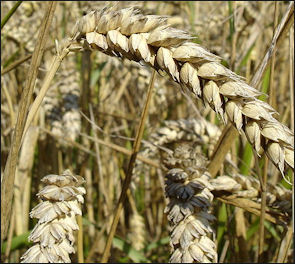
GRAINS
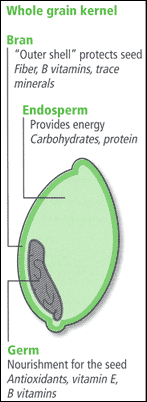
grain structure Grains are members of the grass family. Scientists have found genetic evidence that the world's four major grains — wheat, rice, corn and sorghum — evolved from a common ancestor weed that grew 65 million years ago.
Grains like oats, barley, wheat and rye contain three parts: 1) the endosperm (rich in carbohydrates and protein); 2) the bran (rich in fiber, B vitamins, chromium and other minerals); and 3) the germ (rich in B, E, and K vitamins, iron and other minerals). Milling grains into flour usually removes the germ and bran, leaving only the endosperms. Manufacturers often enrich their products with the missing nutrients.
Grain protein, called gluten, is nutritious and provides a stickiness useful in trapping yeast and making bread. Grains like oats, barley and rye are rich are soluble fiber, which slows down digestion and helps lower cholesterol. Wheat is high in insoluble fiber which helps keep bowel movements regular.
Grains as Steppe Grasses
Grains such as wheat, barley, oats and rye were originally steppe grasses. The grass family is one of the largest in the plant kingdom, embracing some 10,000 different species worldwide. Contrary to what you might think, grasses are fairly complex plants. What you see are only their leaves.
Grass flowers are often not recognizable as such. Because grasses rely on the breeze to distribute pollen (there is a usually lots of wind on the steppe) and they don’t need colorful flowers to attract pollinators such as birds and bees. Grass flowers have scales instead of pedals and grow in clusters on special tall stems that lift them high enough to be carried by the wind.
Grasses need lots of sunlight. They do not grow well in forests or other shady areas. Tall feather grass grows well in the well-watered parts of the steppe. Shorter grass grows better in the dry steppe where there is less rainfall. Chiy, a grass with cane-like reeds, is used by nomads to make decorative screens in the yurts
Grasses can tolerate lack of rain, intense sunlight, strong winds, shredding from lawnmowers, the cleats of Athletes and the hooves of grazing animals. They can survive fires: only their leaves burn; the root stocks are rarely damaged.
The ability of grass to endure such harsh conditions lies in the structures of its leaves, The leaves of other plants spring from buds and have a developed a network of veins that carry sap and expand into the leaf. If a leaf is damaged a plant can seal its veins with sap but do little else. Grass leaves on the other hand don't have a network of veins, rather they have unbranched veins that grow straight, and can tolerate being cut, broken or damaged, and keep growing.
See Separate Article MILLET, SORGHUM, OATS AND RYE factsanddetails.com
Wheat
Wheat is one of the world's top food crops and one of the first to be cultivated. The development of wheat agriculture is credited with dividing the Stone Age from the age of civilized man. Today, wheat is the world’s No.2 dietary staple just behind rice but ahead of corn and bananas, accounting for 19 percent of all the calories that mankind consumes, compared to 20 percent for rice.
Wheat can easily be grown, handled and stored and keeps so well it can shipped anywhere and stored for years. It yields a large amount of food for its weight and can be used in making a wide variety of foods: bread in Germany, noodles in China, pasta in Italy, couscous in North Africa, and breakfast cereal in the United States.
Most wheat is divided into two types: hard wheat and soft wheat. Hard wheat such as durums are used to make pastas and soft wheats are used in pastries, noodles and mixed with other grains for bread. Soft wheats alone lack the stickiness to make bread and stiffness for pasta.
See Separate Article WHEAT: AGRICULTURE, PRODUCERS AND EXPORTERS factsanddetails.com
Barley
Barley is a grain that is similar to wheat in appearance and is the only grain that grows well in the extreme north and in high altitudes. It can be found in Arctic regions and in the high Himalayas. Russia leads the world in barley productions (around 42 million tons a year).
Barley is rich is soluble fiber, which slows down digestion and helps lower cholesterol. It is rarely eaten in the West anymore because it regarded as coarse and is associated with peasant food.
Barley is made into black barley bread and sometimes served as a side dish. Traditionally barley has been a less important food source than other grains because it contains only small amounts of gluten, which is desirable when making bread. It is chiefly used as livestock feed, malt, thickening soups and modifying cow's milk for babies.
See Separate Article BARLEY: ITS HISTORY, USES AND PRODUCERS factsanddetails.com
World’s Main Flour Exporting Countries
wheatWorld’s Top Exporters of Flour, cereals (2020): 1) Canada: 267968 tonnes; 2) Thailand: 157397 tonnes; 3) Ireland: 48681 tonnes; 4) United States: 47107 tonnes; 5) India: 27003 tonnes; 6) Poland: 15636 tonnes; 7) Spain: 15287 tonnes; 8) Australia: 13134 tonnes; 9) Mexico: 11470 tonnes; 10) South Africa: 8724 tonnes; 11) Vietnam: 8534 tonnes; 12) Sweden: 8273 tonnes; 13) Pakistan: 7739 tonnes; 14) Belgium: 7141 tonnes; 15) Hong Kong: 7135 tonnes; 16) Italy: 7047 tonnes; 17) Chile: 6971 tonnes; 18) Netherlands: 6839 tonnes; 19) United Arab Emirates: 6128 tonnes; 20) Lithuania: 5878 tonnes ; [Source: FAOSTAT, Food and Agriculture Organization (U.N.), fao.org. A tonne (or metric ton) is a metric unit of mass equivalent to 1,000 kilograms (kgs) or 2,204.6 pounds (lbs). A ton is an imperial unit of mass equivalent to 1,016.047 kg or 2,240 lbs.]
World’s Top Exporters (in value terms) of Flour, Cereals (2020): 1) Thailand: US$171347,000; 2) Canada: US$131084,000; 3) United States: US$41844,000; 4) India: US$22236,000; 5) Poland: US$17831,000; 6) Mexico: US$15677,000; 7) Ireland: US$15533,000; 8) Vietnam: US$11520,000; 9) Spain: US$11246,000; 10) Italy: US$11159,000; 11) Netherlands: US$9614,000; 12) Hong Kong: US$8127,000; 13) Australia: US$8102,000; 14) South Africa: US$5758,000; 15) Uganda: US$5677,000; 16) Austria: US$4899,000; 17) Finland: US$4763,000; 18) United Arab Emirates: US$4675,000; 19) Pakistan: US$4628,000; 20) Chile: US$4421,000
World’s Main Bread Exporting and Importing Countries
World’s Top Exporters of Bread (2020): 1) Thailand: 45220 tonnes; 2) Germany: 43072 tonnes; 3) Italy: 40525 tonnes; 4) Sweden: 40246 tonnes; 5) Saudi Arabia: 38221 tonnes; 6) Netherlands: 32494 tonnes; 7) Canada: 24847 tonnes; 8) United States: 23969 tonnes; 9) United Kingdom: 23006 tonnes; 10) Spain: 20197 tonnes; 11) Finland: 18896 tonnes; 12) Russia: 17817 tonnes; 13) Belarus: 17758 tonnes; 14) Portugal: 14358 tonnes; 15) Poland: 13929 tonnes; 16) Bangladesh: 13883 tonnes; 17) France: 13287 tonnes; 18) Bulgaria: 10480 tonnes; 19) India: 10030 tonnes; 20) Lithuania: 8725 tonnes ; [Source: FAOSTAT, Food and Agriculture Organization (U.N.), fao.org]
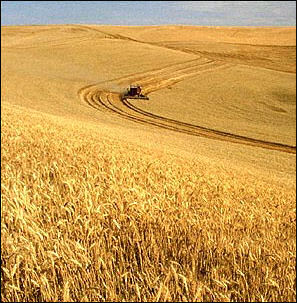
Wheat harvestWorld’s Top Exporters (in value terms) of Bread (2020): 1) Italy: US$139616,000; 2) Germany: US$138083,000; 3) Thailand: US$133744,000; 4) Sweden: US$109831,000; 5) Canada: US$107621,000; 6) Saudi Arabia: US$80868,000; 7) Netherlands: US$78513,000; 8) United States: US$59763,000; 9) Spain: US$46342,000; 10) United Kingdom: US$42209,000; 11) France: US$40855,000; 12) Finland: US$37050,000; 13) Portugal: US$35647,000; 14) Bulgaria: US$33005,000; 15) Poland: US$30827,000; 16) Russia: US$27854,000; 17) India: US$24346,000; 18) Norway: US$22400,000; 19) Belarus: US$22277,000; 20) Romania: US$21739,000
World’s Top Importers of Bread (2020): 1) Belarus: 40184 tonnes; 2) France: 39411 tonnes; 3) United States: 38768 tonnes; 4) Germany: 30153 tonnes; 5) Belgium: 27538 tonnes; 6) Netherlands: 25772 tonnes; 7) Spain: 21472 tonnes; 8) United Kingdom: 20458 tonnes; 9) Italy: 16746 tonnes; 10) Russia: 16503 tonnes; 11) Canada: 14682 tonnes; 12) United Arab Emirates: 14571 tonnes; 13) Norway: 14048 tonnes; 14) Saudi Arabia: 12115 tonnes; 15) Ireland: 11501 tonnes; 16) Austria: 11026 tonnes; 17) Sweden: 10146 tonnes; 18) Kuwait: 9947 tonnes; 19) Australia: 9500 tonnes; 20) India: 8470 tonnes
World’s Top Importers (in value terms) of Bread (2020): 1) United States: US$164882,000; 2) France: US$114709,000; 3) Germany: US$79192,000; 4) Belarus: US$70202,000; 5) Netherlands: US$66332,000; 6) United Kingdom: US$60573,000; 7) Spain: US$59341,000; 8) Belgium: US$55168,000; 9) Canada: US$51350,000; 10) Italy: US$41315,000; 11) Norway: US$38366,000; 12) Denmark: US$36847,000; 13) Sweden: US$34319,000; 14) Australia: US$31157,000; 15) Ireland: US$30624,000; 16) Kuwait: US$30396,000; 17) United Arab Emirates: US$27130,000; 18) Austria: US$25574,000; 19) Russia: US$24339,000; 20) Saudi Arabia: US$23660,000 ; [Source: FAOSTAT, Food and Agriculture Organization (U.N.), fao.org]
World’s Main Pastry Exporting and Importing Countries
World’s Top Exporters of Pastry (2020): 1) Germany: 1005092 tonnes; 2) Mexico: 707967 tonnes; 3) France: 682333 tonnes; 4) Belgium: 661391 tonnes; 5) Canada: 660170 tonnes; 6) Netherlands: 613684 tonnes; 7) United States: 585191 tonnes; 8) Poland: 569370 tonnes; 9) Spain: 511259 tonnes; 10) Italy: 466044 tonnes; 11) Turkey: 392101 tonnes; 12) United Kingdom: 342682 tonnes; 13) Malaysia: 235607 tonnes; 14) India: 208865 tonnes; 15) Russia: 206144 tonnes; 16) Ireland: 190812 tonnes; 17) Austria: 171028 tonnes; 18) Czechia: 165620 tonnes; 19) Indonesia: 151782 tonnes; 20) Sweden: 135146 tonnes ; [Source: FAOSTAT, Food and Agriculture Organization (U.N.), fao.org]
World’s Top Exporters (in value terms) of Pastry (2020): 1) Germany: US$3138572,000; 2) Canada: US$2676250,000; 3) France: US$2164801,000; 4) Belgium: US$2110587,000; 5) Italy: US$1896297,000; 6) United States: US$1895359,000; 7) Netherlands: US$1802265,000; 8) Mexico: US$1451998,000; 9) Poland: US$1417918,000; 10) Spain: US$1228018,000; 11) United Kingdom: US$1045896,000; 12) Turkey: US$734488,000; 13) Malaysia: US$480280,000; 14) Austria: US$469004,000; 15) Ireland: US$461038,000; 16) Sweden: US$431124,000; 17) Czechia: US$403962,000; 18) China: US$397059,000; 19) Denmark: US$353312,000; 20) Indonesia: US$349025,000
World’s Top Importers of Pastry (2020): 1) United States: 1776345 tonnes; 2) United Kingdom: 961836 tonnes; 3) France: 682803 tonnes; 4) Germany: 657919 tonnes; 5) Netherlands: 543875 tonnes; 6) Belgium: 355578 tonnes; 7) Canada: 265556 tonnes; 8) Spain: 229772 tonnes; 9) Australia: 185987 tonnes; 10) Ireland: 180653 tonnes; 11) Italy: 177804 tonnes; 12) Austria: 169911 tonnes; 13) Poland: 165801 tonnes; 14) Portugal: 165023 tonnes; 15) Czechia: 160250 tonnes; 16) Iraq: 154083 tonnes; 17) Sweden: 144496 tonnes; 18) United Arab Emirates: 143135 tonnes; 19) Denmark: 136267 tonnes; 20) Saudi Arabia: 134563 tonnes
World’s Top Importers (in value terms) of Pastry (2020): 1) United States: US$5682769,000; 2) United Kingdom: US$2642191,000; 3) Germany: US$1996951,000; 4) France: US$1961874,000; 5) Netherlands: US$1301241,000; 6) Belgium: US$988464,000; 7) Canada: US$947601,000; 8) Australia: US$694076,000; 9) China: US$658350,000; 10) Spain: US$626883,000; 11) Italy: US$587658,000; 12) Austria: US$566171,000; 13) Ireland: US$514812,000; 14) Switzerland: US$487063,000; 15) United Arab Emirates: US$477237,000; 16) Saudi Arabia: US$471743,000; 17) Japan: US$403849,000; 18) Hong Kong: US$399426,000; 19) Poland: US$397280,000; 20) Sweden: US$384592,000
World’s Main Pasta Exporting and Importing Countries
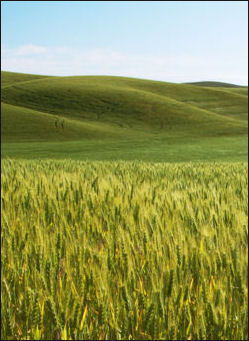
Barley fieldIn many places the word macaroni describes a variety of pastas, including spaghetti.
World’s Top Exporters of Macaroni (2020): 1) Italy: 2288334 tonnes; 2) Turkey: 1405069 tonnes; 3) Egypt: 173840 tonnes; 4) Spain: 135412 tonnes; 5) United States: 111567 tonnes; 6) Belgium: 109793 tonnes; 7) Saudi Arabia: 98002 tonnes; 8) Thailand: 79530 tonnes; 9) Greece: 67933 tonnes; 10) Germany: 64564 tonnes; 11) Peru: 62328 tonnes; 12) Canada: 47654 tonnes; 13) Czechia: 43864 tonnes; 14) France: 42428 tonnes; 15) Vietnam: 41600 tonnes; 16) United Arab Emirates: 41118 tonnes; 17) Russia: 35641 tonnes; 18) Latvia: 34151 tonnes; 19) Austria: 33425 tonnes; 20) Mexico: 32254 tonnes ; [Source: FAOSTAT, Food and Agriculture Organization (U.N.), fao.org]
World’s Top Exporters (in value terms) of Macaroni (2020): 1) Italy: US$2661516,000; 2) Turkey: US$724194,000; 3) Saudi Arabia: US$180926,000; 4) United States: US$165627,000; 5) Thailand: US$152836,000; 6) Belgium: US$130713,000; 7) Spain: US$107102,000; 8) Germany: US$103798,000; 9) Canada: US$89364,000; 10) Egypt: US$82036,000; 11) Austria: US$81751,000; 12) Switzerland: US$77438,000; 13) France: US$70958,000; 14) Japan: US$60728,000; 15) Greece: US$58587,000; 16) South Korea: US$55289,000; 17) Netherlands: US$54521,000; 18) Vietnam: US$47146,000; 19) China: US$43745,000; 20) Peru: US$41884,000
World’s Top Importers of Macaroni (2019): 1) United States: 389195 tonnes; 2) Germany: 381663 tonnes; 3) France: 345066 tonnes; 4) Japan: 177194 tonnes; 5) Somalia: 170781 tonnes; 6) United Kingdom: 166789 tonnes; 7) Venezuela: 142402 tonnes; 8) Canada: 123482 tonnes; 9) South Korea: 115806 tonnes; 10) Netherlands: 106774 tonnes; 11) Angola: 97569 tonnes; 12) Belgium: 83443 tonnes; 13) Saudi Arabia: 73739 tonnes; 14) Iraq: 70029 tonnes; 15) Switzerland: 62674 tonnes; 16) Russia: 58738 tonnes; 17) Hong Kong: 58154 tonnes; 18) Sweden: 58126 tonnes; 19) Chile: 57554 tonnes; 20) Spain: 56414 tonnes
World’s Top Importers (in value terms) of Macaroni (2019): 1) United States: US$643864,000; 2) Germany: US$417327,000; 3) France: US$362332,000; 4) Japan: US$239184,000; 5) United Kingdom: US$196272,000; 6) Canada: US$185783,000; 7) Switzerland: US$144937,000; 8) South Korea: US$143536,000; 9) Netherlands: US$134463,000; 10) Venezuela: US$127800,000; 11) Belgium: US$105637,000; 12) Spain: US$89389,000; 13) Somalia: US$82314,000; 14) Australia: US$80001,000; 15) Hong Kong: US$78676,000; 16) Saudi Arabia: US$78120,000; 17) United Arab Emirates: US$73783,000; 18) Sweden: US$69289,000; 19) Austria: US$67827,000; 20) Russia: US$66873,000
World’s Main Breakfast Cereals Exporting and Importing Countries
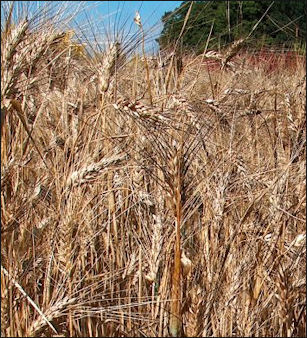
Triticum durum wheatWorld’s Top Exporters of Breakfast Cereals (2020): 1) Turkey: 325512 tonnes; 2) United States: 259322 tonnes; 3) Germany: 256696 tonnes; 4) United Kingdom: 218227 tonnes; 5) Belgium: 174833 tonnes; 6) Poland: 170266 tonnes; 7) France: 159428 tonnes; 8) Spain: 139867 tonnes; 9) Mexico: 137497 tonnes; 10) Canada: 136903 tonnes; 11) Netherlands: 99969 tonnes; 12) China: 94481 tonnes; 13) Thailand: 61188 tonnes; 14) Italy: 55699 tonnes; 15) South Africa: 45882 tonnes; 16) India: 41843 tonnes; 17) Australia: 41391 tonnes; 18) Chile: 41320 tonnes; 19) Czechia: 38058 tonnes; 20) Russia: 26552 tonnes ; [Source: FAOSTAT, Food and Agriculture Organization (U.N.), fao.org]
World’s Top Exporters (in value terms) of Breakfast Cereals (2020): 1) Germany: US$742672,000; 2) United States: US$669991,000; 3) United Kingdom: US$667190,000; 4) Belgium: US$481950,000; 5) Poland: US$430353,000; 6) Spain: US$405262,000; 7) France: US$402675,000; 8) Canada: US$339610,000; 9) Mexico: US$334387,000; 10) Netherlands: US$265995,000; 11) China: US$256710,000; 12) Turkey: US$195367,000; 13) Thailand: US$192491,000; 14) Italy: US$152546,000; 15) Czechia: US$102251,000; 16) Japan: US$97335,000; 17) Australia: US$95199,000; 18) South Korea: US$92530,000; 19) Switzerland: US$73430,000; 20) South Africa: US$64708,000
World’s Top Importers of Breakfast Cereals (2020): 1) Canada: 288272 tonnes; 2) United States: 278155 tonnes; 3) Germany: 187682 tonnes; 4) France: 150839 tonnes; 5) United Kingdom: 150388 tonnes; 6) Belgium: 139477 tonnes; 7) Netherlands: 116967 tonnes; 8) Iraq: 98120 tonnes; 9) China: 91657 tonnes; 10) Spain: 84170 tonnes; 11) Italy: 74806 tonnes; 12) Syria: 61191 tonnes; 13) Sweden: 49733 tonnes; 14) Ireland: 49101 tonnes; 15) Nigeria: 44659 tonnes; 16) Australia: 41903 tonnes; 17) Philippines: 41027 tonnes; 18) Guatemala: 38596 tonnes; 19) Poland: 38126 tonnes; 20) Greece: 37076 tonnes
World’s Top Importers (in value terms) of Breakfast Cereals (2020): 1) United States: US$728005,000; 2) Canada: US$545714,000; 3) Germany: US$456256,000; 4) France: US$444221,000; 5) United Kingdom: US$413872,000; 6) Netherlands: US$269386,000; 7) Belgium: US$266964,000; 8) China: US$260660,000; 9) Italy: US$244599,000; 10) Spain: US$196344,000; 11) Ireland: US$153667,000; 12) Sweden: US$142028,000; 13) Australia: US$135832,000; 14) Saudi Arabia: US$112774,000; 15) Austria: US$102247,000; 16) Greece: US$101092,000; 17) United Arab Emirates: US$93878,000; 18) Switzerland: US$82408,000; 19) Denmark: US$81279,000; 20) Guatemala: US$71416,000 Image Sources: Wikimedia Commons
Text Sources: National Geographic, New York Times, Washington Post, Los Angeles Times, Smithsonian magazine, Natural History magazine, Discover magazine, Times of London, The New Yorker, Time, Newsweek, Reuters, AP, AFP, Lonely Planet Guides, Compton’s Encyclopedia and various books and other publications.
Last updated March 2022

