MILLET
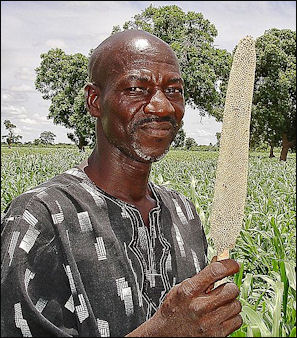
millet in Mali Millet is a hard cereal that resembles a cat tail with wheat-like stalks growing out of it. Although virtually unknown in North America and western Europe, this tiny, round yellowish grain is eaten by millions of people, many of them very poor, in semiarid regions of tropical Africa and Asia.
The earliest identified crops in China were two drought-resistant species of millet in the north and rice in the south. Domesticated millet was produced in China by 6000 B.C. Most ancient Chinese ate millet before they ate rice. Millet's small seeds can be ground into meal or flour or eaten as whole grain. Because it isn't glutinous, millet flour does not rise and can be made only into a flat, or pan, bread. And, due to millet’s inability to grow in the winter, it was not able to compete with barley and wheat to become a principal in certain regions of the Mediterranean. The Romans used millet to produce a kind of mix porridge.
Millet is rich in carbohydrates, protein, fat, the B Vitamins: thiamin, riboflavin, and minerals and contains all of the essential amino acids. Because of its ability to increase in volume during cooking, millet is a great old grain to have around the kitchen. In America millet has been adapted to produce a variety of staple foods namely, flour, syrup and bread and secondary products such as alcoholic beverages, fuel and paper. Millet is also used in feeding livestock, poultry and wild birds.
Millet Agriculture
Millet grows in a wide range of climates and soils and comes in many varieties. It needs less sun and water than rice and grows well in mountains and semi-deserts where other crops have difficulty growing. Millet was once grown in western Europe, where it was known as the "poor man's cereal." But over time it has been replaced by rye and wheat. It is still raised in Eastern Europe, where it is used for making bread, porridge and beer.
Millet favours uphill locations, doesn’t require much water, and has a short growing season: it can be harvested 45 days after planting, compared with 100 days for rice, allowing a very mobile form of cultivation. Researchers say that millet can be made resistant to drought and salt; the nutritional value of its food volume can be boosted; and it can be made resistant to diseases and bacteria through bioengineering. Like sorghum and cassava, unfortunately, it receives little attention from agricultural biotechnology giants like Monsanto and Pioneer Hi-Bred International because there is little profit in it for them.
Millet is important in Africa, the Far East and India since the bulk of their food consumption is from grain. North Africa, the East Indies and Canada are just a few of the regions that grow millet. A dry hot climate and an arid soil were important if the cultivation of millet was to reach its fullest potential. The U.S. grows millet, but summer heat in most places is not strong enough to to bring the grain to its full potential.
Millet is one of the world’s oldest crops. See Separate Article FIRST GRAINS AND EARLIEST CROPS: BARLEY, EINKORN AND EMMER WHEAT, MILLET, SORGHUM, RICE AND CORN factsanddetails.com
World’s Main Millet Producing Countries
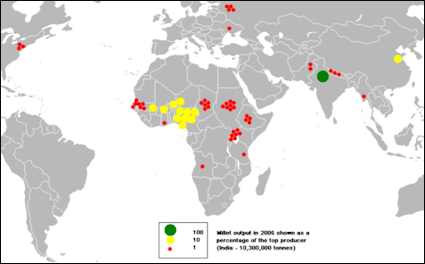
World’s Top Producers of Millet (2020): 1) India: 12490000 tonnes; 2) Niger: 3508903 tonnes; 3) China: 2300000 tonnes; 4) Nigeria: 2000000 tonnes; 5) Mali: 1921171 tonnes; 6) Ethiopia: 1218582 tonnes; 7) Senegal: 1144855 tonnes; 8) Burkina Faso: 957000 tonnes; 9) Chad: 686584 tonnes; 10) Sudan: 484960 tonnes; 11) Russia: 396458 tonnes; 12) Tanzania: 325000 tonnes; 13) Nepal: 320953 tonnes; 14) Pakistan: 266076 tonnes; 15) Ukraine: 256050 tonnes; 16) Guinea: 213420 tonnes; 17) Uganda: 209671 tonnes; 18) United States: 208880 tonnes; 19) Ghana: 170000 tonnes; 20) Kenya: 153000 tonnes ; [Source: FAOSTAT, Food and Agriculture Organization (U.N.), fao.org. A tonne (or metric ton) is a metric unit of mass equivalent to 1,000 kilograms (kgs) or 2,204.6 pounds (lbs). A ton is an imperial unit of mass equivalent to 1,016.047 kg or 2,240 lbs.]
World’s Top Producers (in terms of value) of Millet (2019): 1) India: Int.$3071736,000 ; 2) Niger: Int.$981451,000 ; 3) China: Int.$690222,000 ; 4) Nigeria: Int.$600193,000 ; 5) Mali: Int.$563739,000 ; 6) Sudan: Int.$340009,000 ; 7) Ethiopia: Int.$337896,000 ; 8) Burkina Faso: Int.$291146,000 ; 9) Senegal: Int.$242191,000 ; 10) Chad: Int.$215356,000 ; 11) Russia: Int.$131974,000 ; 12) Tanzania: Int.$115826,000 ; 13) Pakistan: Int.$115350,000 ; 14) United States: Int.$113034,000 ; 15) Nepal: Int.$94298,000 ; 16) Uganda: Int.$72955,000 ; 17) Guinea: Int.$66988,000 ; 18) Ghana: Int.$57018,000 ; 19) Ukraine: Int.$50935,000 ; [An international dollar (Int.$) buys a comparable amount of goods in the cited country that a U.S. dollar would buy in the United States.]
Top millet-producing countries in 20008: (first, Production, $1000; second, Production, metric tons, FAO): 1) India, 1841508 , 11340000; 2) Nigeria, 1300298 , 9064000; 3) Niger, 506067 , 3489400; 4) Burkina Faso, 209988 , 1255189; 5) Mali, 209165 , 1413908; 6) Sudan, 118674 , 721000; 7) Uganda, 118197 , 783000; 8) China, 114384 , 1551000; 9) Senegal, 107953 , 678171; 10) Chad, 85028 , 523162; 11) Ethiopia, 81204 , 484409; 12) Russian Federation, 56099 , 711010; 13) Nepal, 48782 , 291098; 14) United Republic of Tanzania, 35917 , 219000; 15) Ghana, 32733 , 193840; 16) Myanmar, 24621 , 166000; 17) Pakistan, 24295 , 296400; 18) Gambia, 19913 , 125624; 19) Ukraine, 14957 , 220700; 20) Guinea, 12464 , 323000;
World’s Main Exporting and Importing Countries of Millet
Top millet-producing countries World’s Top Exporters of Millet (2020): 1) Ukraine: 116395 tonnes; 2) United States: 100158 tonnes; 3) India: 76481 tonnes; 4) Russia: 42962 tonnes; 5) France: 25317 tonnes; 6) Tanzania: 17469 tonnes; 7) Turkey: 14159 tonnes; 8) Pakistan: 12377 tonnes; 9) Myanmar: 12117 tonnes; 10) Netherlands: 9369 tonnes; 11) Uzbekistan: 8780 tonnes; 12) Austria: 7453 tonnes; 13) Burkina Faso: 6960 tonnes; 14) Canada: 6402 tonnes; 15) Egypt: 5421 tonnes; 16) Poland: 5391 tonnes; 17) China: 5302 tonnes; 18) Germany: 3890 tonnes; 19) Australia: 3870 tonnes; 20) Mali: 3472 tonnes ; [Source: FAOSTAT, Food and Agriculture Organization (U.N.), fao.org]
World’s Top Exporters (in value terms) of Millet (2020): 1) United States: US$46143,000; 2) Ukraine: US$29375,000; 3) India: US$24956,000; 4) France: US$11236,000; 5) Russia: US$11049,000; 6) Netherlands: US$7038,000; 7) China: US$6446,000; 8) Austria: US$5850,000; 9) Uzbekistan: US$5172,000; 10) Myanmar: US$4291,000; 11) Turkey: US$4268,000; 12) Germany: US$3308,000; 13) Tanzania: US$3270,000; 14) Pakistan: US$3018,000; 15) Canada: US$2947,000; 16) Belgium: US$2855,000; 17) Poland: US$2759,000; 18) Australia: US$2630,000; 19) Czechia: US$2023,000; 20) Argentina: US$1214,000
World’s Top Importers of Millet (2020): 1) Indonesia: 75546 tonnes; 2) Belgium: 28679 tonnes; 3) Germany: 28023 tonnes; 4) United Kingdom: 25536 tonnes; 5) Turkey: 24759 tonnes; 6) Netherlands: 18587 tonnes; 7) Iraq: 18583 tonnes; 8) Nepal: 18350 tonnes; 9) United Arab Emirates: 18082 tonnes; 10) Canada: 16322 tonnes; 11) South Korea: 13726 tonnes; 12) Italy: 12803 tonnes; 13) Spain: 12629 tonnes; 14) Poland: 9530 tonnes; 15) Japan: 9464 tonnes; 16) Kenya: 9442 tonnes; 17) Malaysia: 8251 tonnes; 18) South Africa: 8111 tonnes; 19) Burundi: 8045 tonnes; 20) Iran: 8000 tonnes ; [Source: FAOSTAT, Food and Agriculture Organization (U.N.), fao.org]
World’s Top Importers (in value terms) of Millet (2020): 1) Indonesia: US$34200,000; 2) Germany: US$15407,000; 3) Belgium: US$13778,000; 4) United Kingdom: US$11470,000; 5) South Korea: US$10915,000; 6) Canada: US$9705,000; 7) Netherlands: US$9387,000; 8) Japan: US$6767,000; 9) Italy: US$6451,000; 10) Turkey: US$6063,000; 11) Iraq: US$6015,000; 12) Nepal: US$5618,000; 13) United Arab Emirates: US$5263,000; 14) Spain: US$4794,000; 15) Malaysia: US$4424,000; 16) France: US$4383,000; 17) Kenya: US$3786,000; 18) United States: US$3715,000; 19) Thailand: US$3453,000; 20) Australia: US$3330,000
Sorghum
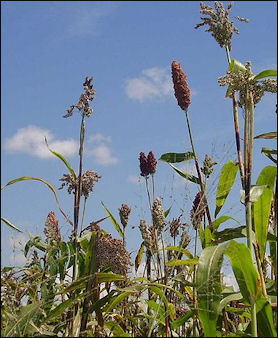
sorghum harvest Sorghum (Sorghum bicolor) is a versatile grass originating from Africa. A close relative of millet and used for thousands of years by prehistoric peoples, it is a purplish red grain that grow at the top of a corn-like plant. It requires relatively little water and grows well in mountainous and semi-desert areas. It provides human food, feed grain, molasses, pasturage and broom straw. Sorghum is regarded as one of the world’s five most important cereal crops, along with rice, wheat, barley, and maize.
Sorghum is grown in 66 countries. It is the leading cereal grain in Africa and is an important food source in Asia and the Middle East. It is used to make unleavened bread, boiled into porridge or gruel, or processed into malted beverages and specialty foods such as popped grain and beer. The United States is the world’s leading producer. Most of sorghum produced there and in Latin America is used as livestock feed.
Sorghum is sometimes called milo. As is true with oats and rice, sorghum seeds are contained in branching heads called panicles. There are approximately 750 to 1,250 seeds in one sorghum grain head. Sorghum such as kafir and durra are sometimes classified as varieties of millet.
Sorghum is a gluten-free grain. The U.S. produces about 10 million metric tons of it a year. The majority of it used for animal feed and ethanol production. Researchers say that sorghum can be made resistant to drought and salt; the nutritional value of its food volume can be boosted; and it can be made resistant to diseases and bacteria through bioengineering. Like millet and cassava, unfortunately, it receives little attention from agricultural biotechnology giants like Monsanto and Pioneer Hi-Bred International because there is little profit in it for them.
Sorghum is one of the world’s oldest crops. See Separate Article FIRST GRAINS AND EARLIEST CROPS: BARLEY, EINKORN AND EMMER WHEAT, MILLET, SORGHUM, RICE AND CORN factsanddetails.com
World’s Main Sorghum Producing Countries
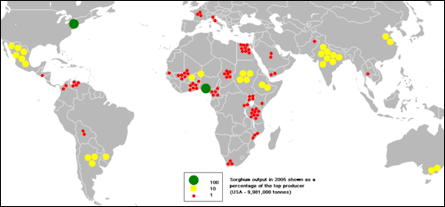
World’s Top Producers of Sorghum (2020): 1) United States: 9473620 tonnes; 2) Nigeria: 6362000 tonnes; 3) Ethiopia: 5058043 tonnes; 4) India: 4770000 tonnes; 5) Mexico: 4704111 tonnes; 6) China: 3550000 tonnes; 7) Brazil: 2769254 tonnes; 8) Sudan: 2537957 tonnes; 9) Niger: 2132295 tonnes; 10) Burkina Faso: 1840000 tonnes; 11) Argentina: 1829914 tonnes; 12) Mali: 1822694 tonnes; 13) Cameroon: 1215377 tonnes; 14) Bolivia: 1018885 tonnes; 15) Chad: 970242 tonnes; 16) Tanzania: 750000 tonnes; 17) South Sudan: 737000 tonnes; 18) Egypt: 730761 tonnes; 19) France: 527070 tonnes; 20) Australia: 397485 tonnes ; [Source: FAOSTAT, Food and Agriculture Organization (U.N.), fao.org. A tonne (or metric ton) is a metric unit of mass equivalent to 1,000 kilograms (kgs) or 2,204.6 pounds (lbs). A ton is an imperial unit of mass equivalent to 1,016.047 kg or 2,240 lbs.]
World’s Top Producers (in terms of value) of Sorghum (2019): 1) United States: Int.$1884150,000 ; 2) Nigeria: Int.$1447845,000 ; 3) Ethiopia: Int.$1143848,000 ; 4) Mexico: Int.$945596,000 ; 5) Sudan: Int.$806796,000 ; 6) China: Int.$782032,000 ; 7) India: Int.$754967,000 ; 8) Brazil: Int.$580495,000 ; 9) Niger: Int.$412009,000 ; 10) Burkina Faso: Int.$406611,000 ; 11) Argentina: Int.$347882,000 ; 12) Mali: Int.$328260,000 ; 13) Cameroon: Int.$264354,000 ; 14) Australia: Int.$252092,000 ; 15) Chad: Int.$211261,000 ; 16) Bolivia: Int.$206161,000 ; 17) Egypt: Int.$172057,000 ; 18) Tanzania: Int.$158986,000 ; 19) South Sudan: Int.$154234,000 ; [An international dollar (Int.$) buys a comparable amount of goods in the cited country that a U.S. dollar would buy in the United States.]
Top sorghum-producing countries in 2008: (first Production, $1000; second, Production, metric tons, FAO): 1) Nigeria, 947613 , 9318000; 2) India, 926989 , 7925900; 3) United States of America, 872380 , 11998040; 4) Sudan, 440261 , 3869000; 5) Ethiopia, 278592 , 2316041; 6) Burkina Faso, 224560 , 1875046; 7) Argentina, 162997 , 2936840; 8) Niger, 136490 , 1311100; 9) China, 132628 , 2502532; 10) Mali, 108784 , 1027202; 11) United Republic of Tanzania, 105947 , 900000; 12) Chad, 80252 , 685430; 13) Cameroon, 70754 , 600000; 14) Uganda, 50219 , 477000; 15) Yemen, 44759 , 376728; 16) Ghana, 40046 , 330950; 17) Eritrea, 36213 , 302515; 18) Egypt, 35700 , 866948; 19) Saudi Arabia, 30430 , 252000; 20) Senegal, 29802 , 251515;
World’s Main Sorghum Exporting and Importing Countries
Top sorghum-producing countries World’s Top Exporters of Sorghum (2020): 1) United States: 6586580 tonnes; 2) Argentina: 462100 tonnes; 3) Australia: 180791 tonnes; 4) France: 167158 tonnes; 5) Ukraine: 118871 tonnes; 6) Kenya: 77208 tonnes; 7) Hungary: 61708 tonnes; 8) Burkina Faso: 41853 tonnes; 9) India: 36617 tonnes; 10) Uganda: 26847 tonnes; 11) China: 21209 tonnes; 12) Russia: 17951 tonnes; 13) Bolivia: 12275 tonnes; 14) Republic of Moldova: 11679 tonnes; 15) Tanzania: 11350 tonnes; 16) Brazil: 11111 tonnes; 17) Paraguay: 7465 tonnes; 18) South Africa: 7203 tonnes; 19) Romania: 6391 tonnes; 20) United Arab Emirates: 4805 tonnes ; [Source: FAOSTAT, Food and Agriculture Organization (U.N.), fao.org]
World’s Top Exporters (in value terms) of Sorghum (2020): 1) United States: US$1392917,000; 2) Argentina: US$84653,000; 3) Australia: US$49561,000; 4) France: US$39187,000; 5) Kenya: US$27246,000; 6) Ukraine: US$20889,000; 7) India: US$16467,000; 8) Uganda: US$12439,000; 9) Hungary: US$11601,000; 10) China: US$9435,000; 11) Bolivia: US$4723,000; 12) Tanzania: US$4161,000; 13) Russia: US$4012,000; 14) Burkina Faso: US$3675,000; 15) South Africa: US$3376,000; 16) Brazil: US$3312,000; 17) Republic of Moldova: US$2492,000; 18) Spain: US$2442,000; 19) Italy: US$1886,000; 20) Romania: US$1274,000
World’s Top Exporters of Sorghum Bran (2020): 1) Afghanistan: 122 tonnes; 2) Philippines: 11 tonnes; 3) Pakistan: 5 tonnes ; [Source: FAOSTAT, Food and Agriculture Organization (U.N.), fao.org]
World’s Top Exporters (in value terms) of Sorghum Bran (2020): 1) Afghanistan: 139,000; 2) Pakistan: 19,000; 3) Philippines: 15,000 US$ ; [Source: FAOSTAT, Food and Agriculture Organization (U.N.), fao.org]
World’s Top Importers of Sorghum (2020): 1) China: 4813474 tonnes; 2) Japan: 382269 tonnes; 3) Mexico: 327825 tonnes; 4) South Sudan: 132551 tonnes; 5) Spain: 125316 tonnes; 6) Ethiopia: 110779 tonnes; 7) Italy: 87110 tonnes; 8) Sudan: 81407 tonnes; 9) Eritrea: 63602 tonnes; 10) Kenya: 58525 tonnes; 11) Somalia: 46820 tonnes; 12) Zimbabwe: 45972 tonnes; 13) Philippines: 44219 tonnes; 14) Belgium: 38519 tonnes; 15) Taiwan: 35578 tonnes; 16) New Zealand: 35166 tonnes; 17) Israel: 34058 tonnes; 18) Rwanda: 33000 tonnes; 19) Djibouti: 30000 tonnes; 20) United Kingdom: 26176 tonnes ; [Source: FAOSTAT, Food and Agriculture Organization (U.N.), fao.org]
World’s Top Importers (in value terms) of Sorghum (2020): 1) China: US$1156072,000; 2) Japan: US$85358,000; 3) Ethiopia: US$77672,000; 4) Mexico: US$72658,000; 5) South Sudan: US$43293,000; 6) Spain: US$25699,000; 7) Italy: US$19955,000; 8) Sudan: US$19706,000; 9) Kenya: US$19337,000; 10) Philippines: US$17151,000; 11) Zimbabwe: US$17024,000; 12) Eritrea: US$16793,000; 13) United Kingdom: US$14203,000; 14) Taiwan: US$12260,000; 15) Belgium: US$9713,000; 16) Bolivia: US$9644,000; 17) Somalia: US$9398,000; 18) New Zealand: US$8531,000; 19) Chad: US$7500,000; 20) Cameroon: US$7322,000
Oats
Oats was the first grain consumed in northern Europe. Believed to be derived from wild oats, it grows well in poor soils and cold climates and has traditionally been used as an animal feed and grain consumed by people in porridge and bread. In the 18th century, Dr. Samuel Johnson described it as "a grain which in England is generally given to horses, but in Scotland supports the people."
The technique of dating starch granules found in cracks in rocks used to grind up plant material have has been used to find the earliest known use of several foods, including 32,600-year-old oats found in southern Italy. [Source: Ian Johnston, The Independent, July 3, 2017]
Oats are high in protein and vitamin B. Like barely and rye they are rich is soluble fiber, which slows down digestion and helps lower cholesterol. In Europe and North America oats are used to make oatmeal, breakfast cereals, bread, and cookies. Breakfast cereals are made from oat flakes, in which the kernels have been separated from the hulls. Most oats are raised as food for livestock and bedding for animals.
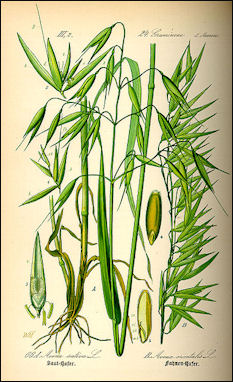
The seeds in oats, rice and sorghum are contained in branching heads called panicles. There are many varieties of oats, and they are classified according to the form and shape of the panicle. As is true with wheat, the plants are resistant to most diseases and pests and seeds are sown are using the broadcasting (scattering) and drilling methods. Freshly cut oats are tied into a tepee-like pyramids and dried by the wind.
The main producers of oats are in North America, the former Soviet Union and western Europe. The average yield is 30 to 40 bushels per acre.
World’s Main Oats Producing, Exporting and Importing Countries
oats World’s Top Producers of Oats (2020): 1) Canada: 4575800 tonnes; 2) Russia: 4132096 tonnes; 3) Poland: 1627140 tonnes; 4) Spain: 1377690 tonnes; 5) Finland: 1212660 tonnes; 6) Australia: 1142934 tonnes; 7) United Kingdom: 1031000 tonnes; 8) United States: 948630 tonnes; 9) Brazil: 898277 tonnes; 10) Sweden: 807600 tonnes; 11) Germany: 721900 tonnes; 12) Argentina: 600105 tonnes; 13) China: 510677 tonnes; 14) Ukraine: 510000 tonnes; 15) Chile: 477396 tonnes; 16) Belarus: 444546 tonnes; 17) Denmark: 425660 tonnes; 18) France: 385620 tonnes; 19) Turkey: 314528 tonnes; 20) Norway: 294000 tonnes ; [Source: FAOSTAT, Food and Agriculture Organization (U.N.), fao.org]
World’s Top Producers (in terms of value) of Oats (2019): 1) Russia: Int.$741511,000 ; 2) Canada: Int.$710149,000 ; 3) Poland: Int.$202719,000 ; 4) Finland: Int.$199015,000 ; 5) Australia: Int.$190156,000 ; 6) United Kingdom: Int.$180332,000 ; 7) Brazil: Int.$154261,000 ; 8) Spain: Int.$140981,000 ; 9) United States: Int.$129289,000 ; 10) Sweden: Int.$112490,000 ; 11) Argentina: Int.$95802,000 ; 12) Germany: Int.$87032,000 ; 13) China: Int.$83037,000 ; 14) Ukraine: Int.$70725,000 ; 15) France: Int.$67443,000 ; 16) Chile: Int.$64511,000 ; 17) Belarus: Int.$61717,000 ; 18) Romania: Int.$60597,000 ; 19) Kazakhstan: Int.$44749,000 [An international dollar (Int.$) buys a comparable amount of goods in the cited country that a U.S. dollar would buy in the United States.]
Top oats-producing Countries in 2008: (first, Production, $1000; second, Production, metric tons FAO): 1) United Kingdom, 46185 , 783574; 2inland, 42702 , 1213400; 3) Russian Federation, 35376 , 5834910; 4) Sweden, 34846 , 820000; 5) Australia, 22934 , 1160028; 6) Ukraine, 22343 , 944400; 7) Brazil, 20317 , 238516; 8) Germany, 15155 , 793188; 9) Chile, 11561 , 384224; 10) Belarus, 11416 , 605441; 11) Czech Republic, 4825 , 155868; 12) Hungary, 4016 , 181792; 13) Ireland, 3636 , 176600; 14) Turkey, 3556 , 196099; 15) Latvia, 2821 , 141500; 16) France, 2777 , 471960; 17) Ethiopia, 2518 , 30558; 18) South Africa, 2471 , 45000; 19) Estonia, 2463 , 77500; 20) Norway, 1594 , 327800;
World’s Top Exporters of Oats (2020): 1) Canada: 2022543 tonnes; 2) Finland: 408525 tonnes; 3) Sweden: 186972 tonnes; 4) Poland: 147762 tonnes; 5) Australia: 130359 tonnes; 6) Latvia: 85374 tonnes; 7) Russia: 76153 tonnes; 8) Estonia: 75241 tonnes; 9) France: 70840 tonnes; 10) Lithuania: 69272 tonnes; 11) United Kingdom: 65849 tonnes; 12) Spain: 44480 tonnes; 13) Germany: 41492 tonnes; 14) Belgium: 33985 tonnes; 15) Denmark: 33727 tonnes; 16) United States: 31402 tonnes; 17) Czechia: 29913 tonnes; 18) Bulgaria: 29881 tonnes; 19) Ukraine: 15731 tonnes; 20) Austria: 12426 tonnes
World’s Top Exporters (in value terms) of Oats (2020): 1) Canada: US$466793,000; 2) Finland: US$91606,000; 3) Sweden: US$44203,000; 4) Australia: US$42428,000; 5) Poland: US$32598,000; 6) United Kingdom: US$19871,000; 7) France: US$19774,000; 8) Lithuania: US$19615,000; 9) Estonia: US$19195,000; 10) Latvia: US$17317,000; 11) Russia: US$14526,000; 12) Germany: US$14286,000; 13) United States: US$11599,000; 14) Spain: US$10969,000; 15) United Arab Emirates: US$9356,000; 16) Czechia: US$9161,000; 17) Denmark: US$8638,000; 18) Netherlands: US$7774,000; 19) Belgium: US$7525,000; 20) Bulgaria: US$6582,000
World’s Top Exporters of Oats rolled (2020): 1) Canada: 357216 tonnes; 2) Chile: 220304 tonnes; 3) Germany: 159815 tonnes; 4) Australia: 137032 tonnes; 5) United Kingdom: 77645 tonnes; 6) Latvia: 42290 tonnes; 7) Belgium: 38733 tonnes; 8) Russia: 28394 tonnes; 9) Finland: 26732 tonnes; 10) United States: 19090 tonnes; 11) Lithuania: 16790 tonnes; 12) United Arab Emirates: 16473 tonnes; 13) Malaysia: 13863 tonnes; 14) Ukraine: 12856 tonnes; 15) Denmark: 11672 tonnes; 16) Ireland: 8699 tonnes; 17) Sri Lanka: 8607 tonnes; 18) Czechia: 8469 tonnes; 19) Spain: 8444 tonnes; 20) Netherlands: 6639 tonnes
World’s Top Exporters (in value terms) of Oats rolled (2020): 1) Canada: US$250091,000; 2) Chile: US$131990,000; 3) Germany: US$125572,000; 4) United Kingdom: US$91234,000; 5) Australia: US$91136,000; 6) Latvia: US$29202,000; 7) Finland: US$28534,000; 8) United States: US$26409,000; 9) Malaysia: US$23820,000; 10) United Arab Emirates: US$22669,000; 11) Belgium: US$20091,000; 12) Russia: US$15498,000; 13) Ireland: US$14362,000; 14) Denmark: US$11041,000; 15) Lithuania: US$11028,000; 16) Guatemala: US$9069,000; 17) Netherlands: US$8713,000; 18) Nicaragua: US$7555,000; 19) Czechia: US$7094,000; 20) Poland: US$7069,000
World’s Top Importers of Oats (2020): 1) United States: 1589480 tonnes; 2) Germany: 610361 tonnes; 3) China: 213491 tonnes; 4) Netherlands: 196510 tonnes; 5) Belgium: 145507 tonnes; 6) Chile: 120458 tonnes; 7) Spain: 114556 tonnes; 8) Mexico: 104310 tonnes; 9) Peru: 53569 tonnes; 10) Switzerland: 48492 tonnes; 11) Japan: 46627 tonnes; 12) Denmark: 43670 tonnes; 13) United Arab Emirates: 42758 tonnes; 14) Latvia: 40113 tonnes; 15) Norway: 37732 tonnes; 16) Mongolia: 31307 tonnes; 17) South Africa: 30770 tonnes; 18) India: 29347 tonnes; 19) South Korea: 25977 tonnes; 20) Malaysia: 25286 tonnes ; [Source: FAOSTAT, Food and Agriculture Organization (U.N.), fao.org]
World’s Top Importers (in value terms) of Oats (2020): 1) United States: US$363783,000; 2) Germany: US$149118,000; 3) China: US$68024,000; 4) Netherlands: US$43277,000; 5) Belgium: US$33267,000; 6) Chile: US$32908,000; 7) Spain: US$28885,000; 8) Mexico: US$24454,000; 9) Japan: US$20325,000; 10) Switzerland: US$14393,000; 11) Peru: US$13576,000; 12) Saudi Arabia: US$13096,000; 13) United Arab Emirates: US$12121,000; 14) India: US$11697,000; 15) Denmark: US$11197,000; 16) United Kingdom: US$9959,000; 17) Norway: US$9917,000; 18) Latvia: US$9243,000; 19) Malaysia: US$8816,000; 20) South Korea: US$8398,000
Rye

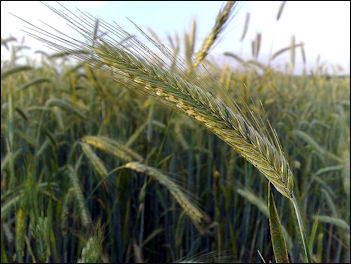
rye by Amakovsky Rye is the principal grain of northern regions. A close relative of wheat, it comes from a weed that invaded wheat fields and probably was first cultivated in a region north of the Black Sea. It appears not to have been cultivated in ancient times like other grains. Rye thrives in areas with poor soil, limited sunshine and extended period of cold, dampness and drought and thus is an ideal crop from northern Europe, Germany, Russia and Scandinavia.
Rye flour usually contains all the parts of the grain, not just the kernels, which means it is richer in protein and other nutrients than other grains. Like oats and barely, rye is rich in soluble fiber, which slows down digestion and helps lower cholesterol. Rye doesn't grow as well in the extreme north and high altitudes as well as barley but it is hardier than wheat. Sometimes called the "grain of poverty" because it flourishes in poor soils, it grows thick, tall and strong when planted in areas used for wheat. Barely, wheat and rye bear their seeds in spikes. The rye plant is too tough and wiry for cattle to graze on but ground rye and rye bran are used in stock feed. Rye straw is longer and more uniform than other grains. It is used to make paper, stuffing and thatch for roofs.
Rye is often made into bread. "Black bread" and pumpernickel are both kinds of rye that are particularly popular in Germany, Russia, Poland, and Scandinavia. Rye flour produces a bread that last longer than other breads. There are tan, brown an almost black rye breads. Most have a malty, slightly sour taste. One problem with rye is that it is vulnerable to attacks from certain funguses and molds, one of them being the source of LSD.
Rye Bread
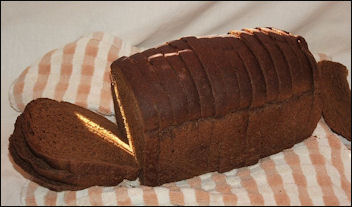
Dark rye bread Germans eat more bread than any other people. In 1994, they consumed 83 kilograms (185 pounds) of bread per person, compared to 56 kilograms in France and 52 kilograms in Britain. Germans are particularly fond of rye bread, which is also very popular in Russia, Poland, and Scandinavia.
The best rye breads are moist and dense. They are made with a sour rye starter and baked in brick-heart ovens. Wheat flour is usually added to lighten and refine the bread. Without it pure rye bread is as heavy as a rock. What distinguishes one rye bred from another is usually the proportions of rye flour to wheat flour. Other factors that influence the character of the bread include the size and shape of the loaf, type of oven (tradition stone-hearth ovens produce a thicker, course crust), the use or whole or crushed rye grains, the addition of caraway seeds, linseeds, pumpkin, sunflower and poppy seeds, olives, carrots, oats, walnuts, hazelnuts, raisons, onions and even ham.
Traditional German bread is made with only six basic ingredients: rye flour, wheat flour, baker's years, water, salt and a sour starter similar to that used in sourdough bread. Bleached flour, like that often used in American breads, is illegal. No milk, sugar, fat, additives or preservatives are used either. The bread generally only lasts up to eight days.
World’s Main Rye Producing, Exporting and Importing Countries
World’s Top Producers of Rye (2020): 1) Germany: 3513400 tonnes; 2) Poland: 2904680 tonnes; 3) Russia: 2377629 tonnes; 4) Belarus: 1050702 tonnes; 5) Denmark: 699370 tonnes; 6) China: 523759 tonnes; 7) Canada: 487800 tonnes; 8) Ukraine: 456780 tonnes; 9) Spain: 407620 tonnes; 10) Turkey: 295681 tonnes; 11) United States: 292930 tonnes; 12) Argentina: 221201 tonnes; 13) Austria: 217930 tonnes; 14) Sweden: 189600 tonnes; 15) Latvia: 178400 tonnes; 16) Czechia: 172360 tonnes; 17) France: 131780 tonnes; 18) Lithuania: 110060 tonnes; 19) Egypt: 91825 tonnes; 20) Hungary: 84350 tonnes ; [Source: FAOSTAT, Food and Agriculture Organization (U.N.), fao.org]
World’s Top Producers (in terms of value) of Rye (2019): 1) Germany: Int.$874325,000 ; 2) Poland: Int.$652352,000 ; 3) Russia: Int.$385750,000 ; 4) Denmark: Int.$238595,000 ; 5) Belarus: Int.$204038,000 ; 6) China: Int.$138095,000 ; 7) Ukraine: Int.$90382,000 ; 8) Canada: Int.$90036,000 ; 9) Turkey: Int.$83717,000 ; 10) United States: Int.$72863,000 ; 11) Spain: Int.$70632,000 ; 12) Sweden: Int.$59763,000 ; 13) Austria: Int.$53922,000 ; 14) Latvia: Int.$51634,000 ; 15) Finland: Int.$50030,000 ; 16) Czechia: Int.$42550,000 ; 17) France: Int.$36554,000 ; 18) Estonia: Int.$32131,000 ; 19) Lithuania: Int.$29182,000 ; [An international dollar (Int.$) buys a comparable amount of goods in the cited country that a U.S. dollar would buy in the United States.]
Ear of rye Top rye-producing countries in 2008: (first, Production, $1000; Production, second, metric tons FAO): 1) Poland, 221713 , 3448550; 2) Germany, 181516 , 3744245; 3) Russian Federation, 168436 , 4505060; 4) Ukraine, 56758 , 1050800; 5) Belarus, 43182 , 1491847; 6) Czech Republic, 19444 , 209787; 7) Turkey, 17827 , 246521; 8) Sweden, 15625 , 168800; 9) Lithuania, 13248 , 204900; 10) Denmark, 13125 , 151500; 11) Austria, 10138 , 218511; 12) Latvia, 8544 , 194900; 13) Slovakia, 7056 , 80349; 14) China, 6109 , 300000; 15inland, 5597 , 60800; 16) Spain, 4890 , 279800; 17) Estonia, 3 , 65600; 18) Hungary, 4412 , 112493; 19) Canada, 4223 , 316200; 20) Egypt, 4203 , 45000;
World’s Top Exporters of Rye (2020): 1) Poland: 1293499 tonnes; 2) Germany: 265205 tonnes; 3) Latvia: 192554 tonnes; 4) Canada: 154685 tonnes; 5) Sweden: 57117 tonnes; 6) Lithuania: 51771 tonnes; 7) Estonia: 42804 tonnes; 8) Czechia: 31005 tonnes; 9) France: 24810 tonnes; 10) Denmark: 18937 tonnes; 11) Slovakia: 18310 tonnes; 12) Spain: 13441 tonnes; 13) Austria: 12178 tonnes; 14) Russia: 11836 tonnes; 15) Finland: 9365 tonnes; 16) Hungary: 7162 tonnes; 17) United States: 5168 tonnes; 18) Ukraine: 4909 tonnes; 19) Kenya: 3966 tonnes; 20) Italy: 2481 tonnes
World’s Top Exporters (in value terms) of Rye (2020): 1) Poland: US$225479,000; 2) Germany: US$67529,000; 3) Canada: US$41431,000; 4) Latvia: US$32954,000; 5) Sweden: US$11194,000; 6) Denmark: US$8896,000; 7) Lithuania: US$8863,000; 8) Estonia: US$7401,000; 9) Czechia: US$5773,000; 10) France: US$5478,000; 11) United States: US$5378,000; 12) Austria: US$5115,000; 13) Slovakia: US$4370,000; 14) Italy: US$3331,000; 15) Spain: US$3300,000; 16) Ukraine: US$2567,000; 17) Russia: US$1792,000; 18) Finland: US$1687,000; 19) Hungary: US$1651,000; 20) Kenya: US$832,000
Leading rye producers in the 1970s: 1) Russia; 2) Germany; 3) Poland; 4) Czechoslovakia; 5) Argentina; 6) Hungary; 7) Turkey.
World’s Main Triticale Producing and Exporting Countries
Triticale is a small-grain cereal developed to combine the quality and uniformity attributes of wheat with the vigour and hardiness of rye.
World’s Top Producers of Triticale (2020): 1) Poland: Triticale: 6079980 tonnes; 2) Germany: 2036300 tonnes; 3) Belarus: 1543087 tonnes; 4) France: 1204040 tonnes; 5) Spain: 786970 tonnes; 6) Lithuania: 437260 tonnes; 7) China: 406391 tonnes; 8) Austria: 328270 tonnes; 9) Russia: 310455 tonnes; 10) Hungary: 304600 tonnes; 11) Turkey: 276212 tonnes; 12) Romania: 235850 tonnes; 13) Czechia: 213260 tonnes; 14) Sweden: 167100 tonnes; 15) Serbia: 126404 tonnes; 16) Chile: 92863 tonnes; 17) Australia: 76857 tonnes; 18) Bosnia and Herzegovina: 61121 tonnes; 19) Italy: 60410 tonnes; 20) Croatia: 50250 tonnes ; [Source: FAOSTAT, Food and Agriculture Organization (U.N.), fao.org]
World’s Top Producers (in terms of value) of Triticale (2019): 1) Poland: Int.$872871,000 ; 2) Germany: Int.$425918,000 ; 3) France: Int.$318527,000 ; 4) Belarus: Int.$254286,000 ; 5) Spain: Int.$116424,000 ; 6) China: Int.$87187,000 ; 7) Russia: Int.$69059,000 ; 8) Lithuania: Int.$67341,000 ; 9) Hungary: Int.$65655,000 ; 10) Austria: Int.$63326,000 ; 11) Romania: Int.$60931,000 ; 12) Turkey: Int.$41738,000 ; 13) Czechia: Int.$37919,000 ; 14) Sweden: Int.$34599,000 ; 15) Chile: Int.$28703,000 ; 16) Serbia: Int.$19838,000 ; 17) Canada: Int.$14010,000 ; 18) Croatia: Int.$12980,000 ; 19) Italy: Int.$11856,000 ; [An international dollar (Int.$) buys a comparable amount of goods in the cited country that a U.S. dollar would buy in the United States.]
World’s Top Exporters of Triticale (2020): 1) Poland: 1063124 tonnes; 2) Lithuania: 193065 tonnes; 3) Germany: 100170 tonnes; 4) France: 54619 tonnes; 5) Hungary: 16067 tonnes; 6) Czechia: 14517 tonnes; 7) Netherlands: 10176 tonnes; 8) Latvia: 9818 tonnes; 9) Luxembourg: 8120 tonnes; 10) Spain: 7297 tonnes; 11) Canada: 5145 tonnes; 12) Austria: 4536 tonnes; 13) Croatia: 4281 tonnes; 14) Slovakia: 3546 tonnes; 15) Romania: 1849 tonnes; 16) Slovenia: 1690 tonnes; 17) Bulgaria: 972 tonnes; 18) Serbia: 642 tonnes; 19) Belgium: 440 tonnes; 20) Greece: 433 tonnes
World’s Top Exporters (in value terms) of Triticale (2020): 1) Poland: US$201883,000; 2) Lithuania: US$37494,000; 3) Germany: US$20546,000; 4) France: US$11184,000; 5) Czechia: US$3265,000; 6) Hungary: US$2981,000; 7) Netherlands: US$2712,000; 8) Canada: US$2494,000; 9) Latvia: US$2476,000; 10) Spain: US$2170,000; 11) Luxembourg: US$1709,000; 12) Austria: US$1689,000; 13) Croatia: US$814,000; 14) Slovakia: US$659,000; 15) Romania: US$560,000; 16) United States: US$294,000; 17) Slovenia: US$292,000; 18) Serbia: US$240,000; 19) Italy: US$215,000; 20 ) Bulgaria: US$203,000
Image Sources: Wikimedia Commons
Text Sources: National Geographic, New York Times, Washington Post, Los Angeles Times, Smithsonian magazine, Natural History magazine, Discover magazine, Times of London, The New Yorker, Time, Newsweek, Reuters, AP, AFP, Lonely Planet Guides, Compton’s Encyclopedia and various books and other publications.
Last updated March 2022

