CLIMATE CHANGE IN THE PAST
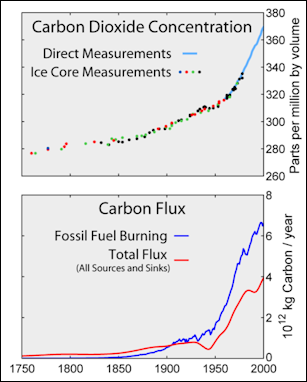
Carbon History
The Swedish scientist Svante Arrhenius (1859-1927), using a slide and pencil to make months of tedious calculations, was the first to make note that carbon dioxide would warm the planet. But he calculated it wouldn’t happen for 3,000 another years.
Research by Michael Story of the Roskilde University in Denmark indicates a period of clomate change that occurred 55 million years ago that caused the Arctic to become tropical. The warming appears to have been was caused by a series of volcanic eruptions in what is now Greenland that caused the European and North American continents to split apart and generated large amount of magma that cooked peat and coal — and oil-forming organic material — and released large amounts of carbon dioxide. Perhaps most worrisome is that Story estimated that the amount of carbon released was on par with that produced by mankind over a longer period of time and the fact it took 100,000 years for the Earth to recover after European magama shock.
A study by Peter Mayhew of the University of York, England, published in the Proceedings of the Royal Society, found that the five periods in earth is history with the highest levels of extinctions were all associated with climate change. Higher temperatures were linked to four of the mass extinctions in the last 525 million to 65 million years ago.
William Ruddiman, a professor emeritus at the University of Virginia, has suggested that human influence on climate goes way back before the Industrial Revolution to the dawn of history when man began clearing forests for agriculture and accelerated when rice agriculture became widespread. Ruddiman and Erle Ellis, a professor at the University of Maryland, wrote in the journal Quaternary Science Review that carbon dioxide levels began increasing about 8,000 years, around the time when early Europeans began burning and clearing forests, and methane levels began rising around 5,000 years ago when the Chinese began flooding lowlands to raise rice. Today the burning and clearing of tropical rainforests is a major cause of carbon dioxide emissions and rice agriculture is a major producer of methane. The presence of carbon dioxide and methane in the atmosphere thousands of years ago was determined by examining bubbles of air trapped for thousands of years in polar ice. Many scientists have trouble with the findings and don’t like what it implies: that climate change has been occurring for some time and we are no more worse off as a result.
Scientists are examining the logbooks of Captain James Cook and other explorers to gain insights into climate change in the past. Cook meticulously recorded detailed weather reports on each day of his voyages in a wide range of locations around the globe. His logs and those of William Bligh’s “Bounty”, the “Beagle”, the ship that carried Charles Darwin and 300 other 18th and 19th century explorers and ships are being transcribed and digitized so climatologists can examine weather patterns as they have occurred and changed over decades and centuries. The information is vital in that there are plenty of land-based reports but few reports from locations at sea and in remote places. Many of the reports have precise latitude and longitude locations as well as accurate data on temperature, ice formation, air pressure and wind speed. Among the findings so far have been a better understanding of the impact of the Mount Tambora eruption in Indonesia in 1815 that ejected so much sun-reflecting sulfur dioxide it caused temperatures to drop around the globe.
See Separate Article GLOBAL WARMING AND RISING SEA LEVELS factsanddetails.com
Prehistoric Glaciers, Climate and Volcanoes
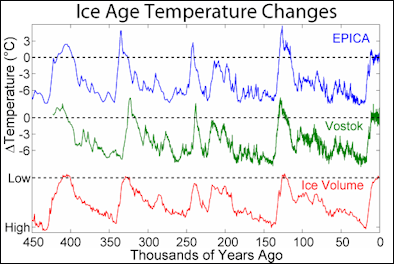
Ice Age temperatures Among the more prominent theories of events that have triggered major global climatic changes in the distant past and lead to repeated glaciation are: 1) known astronomical variations in the orbital elements of the Earth (the so-called Milankovitch theory); 2) changes in energy output from the Sun; and 3) increases in volcanism that could have thrown more airborne volcanic material into the stratosphere, thereby creating a dust veil and lowered temperatures.
The years 1980, 1981, and 1982, for example, saw several major volcanic eruptions adding large quantities of particulate volcanic material and volatiles to the stratosphere, including the catastrophic eruption of Mount St. Helens, Washington, on May 18, 1980: a large eruption of Mount Hekla, Iceland, on August 17, 1980; and the 1982 series of eruptions from El Chichón volcano in Mexico. These eruptions ejected enormous amounts of volcanic material into the stratosphere, which blocked the sun and caused cooling that lingered for several years. About 17 million tons of sulfur dioxide was released by the Pinatubo eruption in the Philippines in 1991. The sulfur dioxide and ash from that eruption produced a cooling effect that lasted several years.
The potential climatic effect of the Laki volcanic eruption in Iceland in 1783, the largest effusive (lava) volcanic eruption in historic time, was noted by the diplomat-scientist Benjamin Franklin in 1784, during one of his many sojourns in Paris. Franklin concluded that the introduction of large quantities of volcanic particles into the Earth's upper atmosphere could cause a reduction in surface temperature, because the particles would lessen the amount of solar energy reaching the Earth's surface. The catastrophic eruption of the Tambora volcano, Indonesia, in 1815 was followed by a so-called "year-without-a-summer." In New England, for example, frost occurred during each of the summer months in 1816.
Abrupt End to Climate Change 12,900 Years Ago Caused by Meteors?
In 2009, the New York Times reported: “At least once in Earth’s history, global warming ended quickly, and scientists have long wondered why. Now researchers are reporting that the abrupt cooling — which took place about 12,900 years ago, just as the planet was emerging from an ice age — may have been caused by one or more meteors that slammed into North America. That could explain the extinction of mammoths, saber-tooth tigers and maybe even the first human inhabitants of the Americas, the scientists report in the journal Science. The hypothesis has been regarded skeptically, but its advocates now report perhaps more convincing residue of impact: a thin layer of microscopic diamonds found in rocks across America and in Europe. “We’re up over 30 sites, as far west as offshore California, as far east as Germany,” said Allen West, a retired geology consultant who is one of the scientists working on the research. [Source: New York Times, January 1, 2009]
“The meteors would have been smaller than the six-mile-wide meteor that struck the Yucatán peninsula 65 million years ago and led to the mass extinctions of the dinosaurs. The killing effects of the hypothesized bombardment 12,900 years ago would have been more subtle. Climatologists believe that the direct cause of the 1,300-year cold spell, known as the Younger Dryas, was a sudden rush of fresh water from a giant lake in central Canada to the North Atlantic. Usually a surface current of warm water flows northward in the Atlantic toward Greenland and Europe, then cools and sinks, returning south in the deep ocean. But the fresh water, which is less dense, blocked the sinking of the cold, salty water in the North Atlantic, disrupting the currents. That sudden change in plumbing has long been known, but what caused it has never been satisfactorily explained.
"The authors of the paper in Science say it was meteors. At each site the scientists looked at, the diamond layer in the rocks correlates to the date of the hypothesized impact. Within the layer, the scientists report finding a multitude of diamond particles, all encased within carbon spheres. “We’ve yet to find a single diamond above it,” Dr. West said. “We’ve yet to find a single diamond below it.” Perhaps more telling, the scientists reported last month at a meeting of the American Geophysical Union in San Francisco, the carbon atoms inside some of the diamonds are lined up in a hexagonal crystal pattern instead of the usual cubic structure. The hexagonal diamonds, formed by extraordinary heat and pressure, have been found only at impact craters and within meteorites and cannot be formed in forest fires or volcanic eruptions, Dr. West said. In 2007, year the scientists presented other evidence of an impact, including elevated levels of the element iridium.
“At least some skeptics are not convinced. “The whole thing still does not make sense, and there are lots of contradictions,” said Christian Koeberl, a professor of geological sciences at the University of Vienna in Austria. His chief reservation is that there is no crater. “A body of this size does not just blow up without a trace in the atmosphere,” Dr. Koeberl said. “Physics won’t have it.” Proponents have suggested that the meteor hit an ice sheet a couple of miles thick or that there was a series of smaller objects that exploded in the air. But Dr. Koeberl said something hitting an ice sheet would still generate a hole in the ground underneath, and he questioned whether smaller impacts or air explosions would produce the shock waves needed to make diamonds.
“An impact should also have left remnants of melted rocks and shocked minerals, Dr. Koeberl said. But if true, the hypothesis could explain the disappearance of ice age mammals like mammoths and argue against the alternative idea that the animals were hunted to extinction by humans.
Nations That Produce the Most Greenhouse Gases
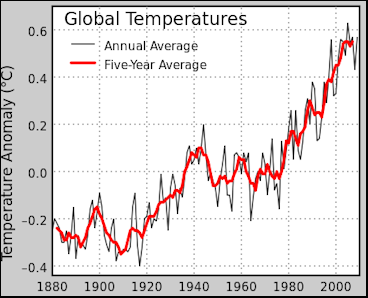
Instrumental Temperature Record Fifty-five countries — about a forth of the world’s total — account for almost 80 percent of the world’s greenhouse gas emissions. In recent years, according to a study by the University of East Anglia in the journal Geoscience in 2009, the total carbon emissions from developing countries (54 percent) — mostly with the contributions of China, India, Indonesia and Brazil — now exceeds that of the developed countries (46 percent) . Emissions from China, India, Indonesia and Brazil doubled between 1990 and 2010.
China is the largest producer of greenhouse gases and the largest emitter of carbon dioxide. It was not supposed to overtake the United States as the world’s leading producer of greenhouse gases until 2010 or 2020 but a study by a Dutch government-funded group released in June 2007 determined that China was already the world’s No. 1 emitter of carbon dioxide at that time. It surpassed the United States in 2006 when it produced 7.5 percent more of these gasses than the United States compared to 2 percent less in 2005. In August 2008, Germany’s IWR Institute concluded that China’s carbon dioxide emissions in 2008 were 6.8 million tons — the most of any nation and 178 percent higher than its 1990 level.
China produces about 23 percent of the world’s carbon dioxide, compared to 21 percent from the United States. China produced 6.23 billion metric tons of carbon dioxide in 2006, compared to 5.8 billion metric tons by the United States. The increase in China was attributed mostly to increased coal consumption and cement production. Russia ranks third in the world in greenhouse gas emissions. It produces 6.2 percent of the world’s carbon dioxide emissions. Japan ranks forth, producing 4.8 percent of world’s carbon dioxide (1.3 billion metric tons of carbon dioxide). India ranks fifth, producing 4.2 percent. Germany is sixth, producing s 3.5 percent of the world’s carbon dioxide emissions.
World's Largest Carbon Dioxide Emitters per Capita
The world's largest carbon dioxide emitters per capita are mostly from major oil-producing countries according to 2019 data in from the Emissions Database for Global Atmospheric Research (EDGAR). The data only contains values for fossil-fuel generated carbon dioxide emissions which is the largest contributor to climate change.[Source: Trish Novicio, Insider Monkey, March 16, 2021]
1) Palau is the worst emitter of carbon dioxide per person in the world. Carbon dioxide emission from fossil fuel per capita were 59.88 metric tonnes in 2019. Carbon dioxide emission from fossil fuel was 1.330 million metric tonnes in 2019. Palau is a small island nation with a small population whose economy is fueled by tourism, fishing and agriculture, and trading. The tourism industry is a major contributor to climate change in Palau. Flights going to and from the country as well boat trips to dive spots and imported foods and fishing all use a lot of fossil fuels.
2) Qatar is the second worst emitter of carbon dioxide per person in the world. Carbon dioxide emission from fossil fuel per capita were 38.82 metric tonnes in 2019. Carbon dioxide emission from fossil fuel was 106.528 million metric tonnes in 2019. Qatar has massive natural gas reserves, and its offshore North Field is one of the world’s biggest gas fields.
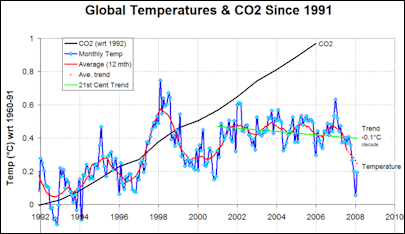
Global temperatures since 1991
3) Trinidad and Tobago is the third worst emitter of carbon dioxide per person in the world. Carbon dioxide emission from fossil fuel per capita were 23.81 metric tonnes in 2019. Carbon dioxide emission from fossil fuel was 32.744 million metric tonnes in 2019. Trinidad and Tobago has the highest average carbon dioxide emissions per person is the Caribbean and is well-known for its fossil-fuel reserves, with the oil and gas industry responsible for roughly 40 percent of GDP and 80 percent of exports. With one of the largest natural gas liquefaction facilities in the Western Hemisphere, the nation generates nearly nine times more natural gas than crude oil, with gas accounting for approximately two-thirds of the energy sector’s revenue.
4) Kuwait is the 4th worst emitter of carbon dioxide per person in the world. Carbon dioxide emission from fossil fuel per capita were 23.39 metric tonnes in 2019. Carbon dioxide emission from fossil fuel was 98.953 million metric tonnes in 2019. Kuwait’s economy is heavily dependent on the extraction and processing of oil and gas which makes it one of the countries with the highest average carbon dioxide emissions per person. The oil and gas sector accounts for approximately 40 percent of the country’s GDP. As the population and industry have expanded through the years, so has the amount of electricity generated.
5) United Arab Emirates is the 5th worst emitter of carbon dioxide per person in the world. Carbon dioxide emission from fossil fuel per capita were 22.99 metric tonnes in 2019. Carbon dioxide emission from fossil fuel was 222.612 million metric tonnes in 2019. The economy of the federation is dominated by petroleum, which is centered primarily in the emirate of Abu Dhabi.
6) Bahrain is the 6th worst emitter of carbon dioxide per person in the world. Carbon dioxide emission from fossil fuel per capita were 21.64 metric tonnes in 2019. Carbon dioxide emission from fossil fuel was 35.438 million metric tonnes in 2019. Bahrain has few petroleum reserves despite being in one of the world's most essential oil-producing regions. It economy is focused on the processing of crude oil from its neighboring countries.
7) Oman is the 7th worst emitter of carbon dioxide per person in the world. Carbon dioxide emission from fossil fuel per capita were 18.55 metric tonnes in 2019. Carbon dioxide emission from fossil fuel was 92.781 million metric tonnes in 2019. Since 1967, when Oman started exporting oil, petroleum has been the driving force of the country's economy. Oman's modern and complex infrastructure, which includes electric utilities, bridges, public education, and medical services, is supported by the oil industry. Oman also has large natural gas reserves.
8) Saudi Arabia is the 8th worst emitter of carbon dioxide per person in the world. Carbon dioxide emission from fossil fuel per capita were 18 metric tonnes in 2019. Carbon dioxide emission from fossil fuel was 614.607 million metric tonnes in 2019.
9) Australia is the 9th worst emitter of carbon dioxide per person in the world. Carbon dioxide emission from fossil fuel per capita were 17.27 metric tonnes in 2019. Carbon dioxide emission from fossil fuel was 433.379 million metric tonnes in 2019. The construction industry is one of the highest contributors of carbon dioxide emissions through the production of construction materials and energy use.
10) Luxembourg is the 10th worst emitter of carbon dioxide per person in the world. Carbon dioxide emission from fossil fuel per capita were 16.31 metric tonnes in 2019. Carbon dioxide emission from fossil fuel was 9.740 million metric tonnes in 2019. Luxembourg relies on fossil fuels and imported energy supply.
11) Brunei is the 11th worst emitter of carbon dioxide per person in the world. Carbon dioxide emission from fossil fuel per capita were 15.98 metric tonnes in 2019. Carbon dioxide emission from fossil fuel was 7.020 million metric tonnes in 2019. Brunei's economy is almost entirely dependent on the exploitation of its massive oil and gas reserves.
12) Canada is the 12th worst emitter of carbon dioxide per person in the world. Carbon dioxide emission from fossil fuel per capita were 15.69 metric tonnes in 2019. Carbon dioxide emission from fossil fuel was 584.846 million metric tonnes in 2019.
13) United States is the 13th worst emitter of carbon dioxide per person in the world. Carbon dioxide emission from fossil fuel per capita were 15.52 metric tonnes in 2019. Carbon dioxide emission from fossil fuel was 5.1 billion metric tonnes in 2019. Based on the data recorded by the U.S. Energy Information Administration in 2019, approximately 46 percent of U.S. energy-related carbon dioxide emissions came from consuming petroleum fuels, 33 percent came from using natural gas, and 21 percent came from burning coal. The agriculture and transportation sectors also generates a lot of carbon dioxide.
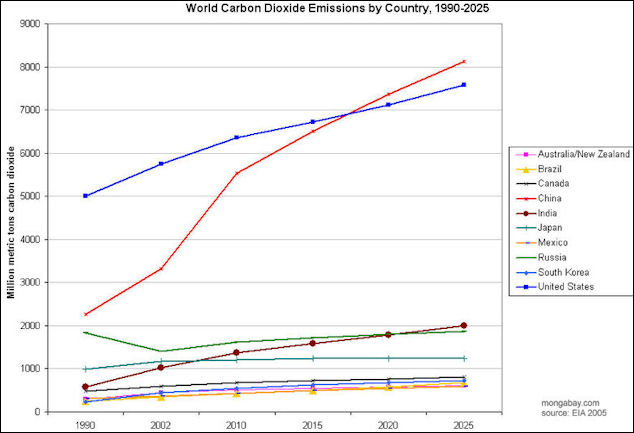
CO2 by-country, 1990-2025
14) Turkmenistan is the 14th worst emitter of carbon dioxide per person in the world. Carbon dioxide emission from fossil fuel per capita were 15.23 tonnes Carbon dioxide emission from fossil fuel was 90.523 million metric tonnes in 2019. The desert country has the fourth-largest natural gas reserves in the world. Also, Turkmenistan's top industries are construction and chemicals and they use a lot of energy.
15) Kazakhstan is the 15th worst emitter of carbon dioxide per person in the world. Carbon dioxide emission from fossil fuel per capita were 14.92 tonnes Carbon dioxide emission from fossil fuel was 277.365 million metric tonnes in 2019. Kazakhstan's economy is heavily dependent on fossil fuels. Around 16 percent of Kazakhstan's GDP came from oil revenues in 2018, while 67 percent of its merchandise exports in 2019 were fuel. According to the IEA, in 2019, about 90 percent of national electricity was obtained from fossil fuels. Coal accounted for 70 percent of electricity generation and natural gas accounted for 20 percent.
Top green house emitters per person in 2010 (tonnes per year): 1) Qatar (66.6); 2) United Arab Emirates (38.2); 3) Kuwait (34.8); 4) Brunei (32.7); 5) Bahrain (29.3); 6) Australia ((27.4); 7) Trinidad & Tobago (27.3); 8) Luxembourg (26.7); 9) the United States (23.5); 10) Canada (22.9); 11) New Zealand (19.1); 12) Turkmenistan (18.9); 13) Oman (18.5); 14) Ireland (16.7); 15) Saudi Arabia (16.3); 16) Equatorial Guinea (15.3); 17) Central African Republic (14.6); 18 Estonia (14.3); 19) Belgium (14.0); 20) Czech Republic (13.9) [Source: World Resources Institute]
Climate Change in Developing Countries
In the future developing countries are predicted to sharply increase their carbon dioxide emissions while emissions from developed countries are expected to remain pretty much the same as they are now. The 2009 World Bank Development Report stated: “Developing countries are disproportionally affected by climate change — a crisis that is not of their making and for which they are the least prepared. Increasingly access to energy and other services using high-carbon technologies will produce more greenhouse gases, hence more climate change.”
The report stated that 75 to 80 percent of the damages caused by climate change through drought, floods and rising seas levels well occur in developing countries. The World Bank is at the forefront of the drive to get the developed countries to foot the bill for projects needed to combat global warming in the developing world.
The World Bank report said that it is a difficult proposition to fight poverty and promote economic growth in the developing world and fight climate change there at the same time. Without reliable sources of energy poor countries have a difficult tine to break out of their cycle of poverty.
In the developing world electricity and fuel shortages are major obstacle to economic growth, creating jobs and having a reasonably comfortable life. One of the primary aims of many poor countries is to ensure there are adequate energy supplies and this goal often involves building more power plants and dams — aims that often run counter to the goals of environmentalists and those combating climate change.
See Coal and Climate Change
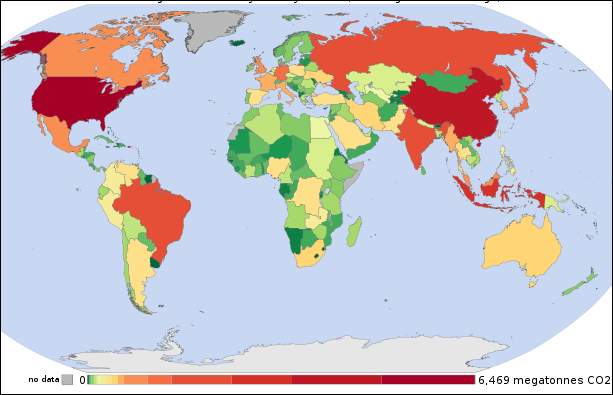
Greenhouse gases by country 2000
Climate Change and Conservative Politics
In recent years global warming has become a prime target of conservative American pundits and politicians. Naomi Oreskes and Erik M. Conway wrote in the Los Angeles Times, “After the collapse of the Soviet Union, the [conservatives] found a new enemy: environmentalists, who were viewed as "watermelons" — green on the outside, red on the inside.” Berkeley scientist William “Nierenberg had paved the way for this target shift, working behind the scenes to weaken the conclusions of important government reports on acid rain and climate change in 1983 and 1984. [Source:Naomi Oreskes and Erik M. Conway, Los Angeles Times. June 8, 2010|]
In the 1990s, Nierenberg and others tried to blame the sun for global warming and volcanoes for the Antarctic ozone hole. They also launched personal attacks on scientists who had done important work on climate issues. In one egregious example, in 1995 they teamed with an industry group, the Global Climate Coalition, to accuse a young scientist, Benjamin Santer of "scientific cleansing" — removing uncertainty from the Intergovernmental Panel on Climate Change's Second Assessment Report. Santer had played a key role in demonstrating the role of human activity in global warming; by attacking him via the Wall Street Journal, they hoped to foster doubt about the IPCC and one of its key conclusions: that humans have caused global warming.”
Describing how conservative global warming politicing can work in India, Jeremy Page wrote in The Times, “V. K. Raina, a former head of the Geological Survey of India, issued a report in November 2009 arguing that Himalayan glaciers formed four million years ago and have been melting ever since. “Himalayan glaciers, although shrinking in volume and constantly showing a retreating front, have not in any way exhibited, especially in recent years, an abnormal annual retreat,” it said. Indian experts almost unanimously panned the report, with Dr R. K. Pachauri, who heads both TERI and IPCC, denouncing it as “schoolboy science”. But Jairam Ramesh, India’s Environment Minister, effectively endorsed it by writing the foreword, holding a press conference to launch it, and placing it on his ministry’s website. Shyam Saran, India’s top climate change negotiator, also backed it.[Source: Jeremy Page, The Times, December 5, 2009]
Climate Change Skeptics, Critics and Naysayers
Among those who claim that too big of a fuss is being made about global warming was Michael Crichton, the late author of “Jurassic Park” and the book “Fear”, which claims the global warming is the eugenics of the 21st century.
Bjorn Lomborg, professor at Copenhagen Business School and organizer of the Copenhagen Consensus, argues that the costs of combating climate change are too high — $150 billion in one of his estimates and $46 trillion by 2100 in another — and the returns are to little to justify the sacrifices made in the name of it. The money, he says, would better spent on fighting hunger, AIDS and malaria and helping the developing world through free trade. He is especially worried about a lot regulations that could hamper free trade and hurt developing countries the most.
Some critics of climate change policy claim that the effects of the sun and sun spots on the Earth’s climate has been far higher than the impact of human activity and argue that actions taken to minimize carbon emissions will have little impact on the climate but could have harmful effects on the world economy. Global warming skeptics point to the fact that during the 20th century solar for example rose about the same level as greenhouses gases and its is difficult to determine which has caused temperatures to rise. They say extreme weather such as the harsh winters of 2007-2008 and 2009-2010 are better explained by year-to-year temperature variations and El Niño-La Niña fluctuations than by global warming. Global warming skeptics also say that Earth goes through natural freeze-and-thaw cycles based on changes in the Earths orbit and these forces have more profound impact on climate change than anything humans do.
Naysayers have also said that the winters of 2007-2008, when snow fell in Baghdad and Johannesburg, and 2009-2010, when the United States experienced record snow storms and Europe had record colds, are evidence that if anything the world is cooling down rather than getting hotter. Kevin Walsh, a meteorology professor at the University of Melbourne, told Reuters, “Global warming is a trend superimposed upon natural variability, variability that still exists despite global warming.”
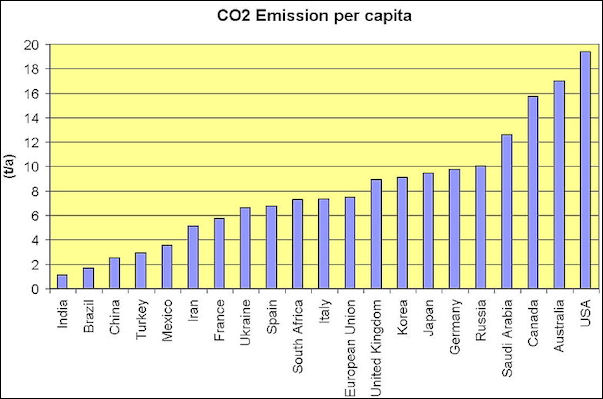
CO2 emission per capita in the late 2000s
Naysayers also jumped all over up a typing mistake in a 2007 Intergovernmental Panel of Climate Change (IPCC) report that stated that Himalayan glaciers were going to disappear in 2035 instead of the intended date of 2350. This and weaknesses in some of the global warming science have given ammunition to climate change critics who claim the data to back up the science on global warming is dubious at best and perhaps even fabricated.
Global warming skeptics also claim that political correctness taints the global warming issue and shapes policy and views about it more than science and reason, They point to some embarrassing hijacked e-mails made public from the University of East Anglia, a major center of climate change research, in 2009 in which scientists there deliberately chose not to voice their suspicions on some data (concerning tree rings in Siberia) and complained about scientists whose views were different from theirs.
Poor Climate Change Data Interpretation?
Bjørn Lomborg wrote: In 2007, the United Nations’ Intergovernmental Panel on Climate Change (IPCC) released a report on climate extremes that received considerable media attention. But, two years later, it was discovered that some of the IPCC report’s key claims — for example, that global warming would cause the immense Himalayan glaciers to disappear by 2035, or halve African crop yields by 2020 — were based on statements made in appeals by environmentalist organizations, and were backed by little or no evidence. [Source:Bjørn Lomborg, Project Syndicate, December 13, 2011]
“Despite this error, the IPCC has long been a fairly reliable source of sensible and responsible estimates in an otherwise histrionic debate. Unfortunately, sensible estimates are not breaking news. For example, according to the IPCC, sea levels will rise by a relatively manageable 18-59 centimeters (7-23 inches) by the end of the century, whereas news organizations and activists regularly claim that we should expect sea levels to rise by meters.
“The media similarly misrepresented the findings of the IPCC’s 2010 report on climate extremes. Sweden’s most prestigious daily newspaper, Svenske Dagbladet, filled almost an entire Sunday front page with an eviscerated body showing exposed arteries, adorned with the warning: “Ever warmer climate threatens more death.” Across two full pages inside, the paper presented a graph of seasonal deaths over the past decade, and indicated with alarming red spots how summer heat waves have killed dozens of Swedes. Yet, even a cursory reading of the graph showed clearly that many more people die from cold than from heat.
“The IPCC report did indeed state that global warming would mean more extreme warm temperatures, but it also pointed to fewer extreme cold temperatures. Because more people almost everywhere on the planet die each year from cold temperatures than from warm temperatures, the overall impact of global warming will be fewer deaths from temperature extremes. Indeed, according to one estimate, by mid-century, about 400,000 more people will die from heat than would have perished at current temperatures, but 1.8 million fewer people will die from cold. Unfortunately, non-deaths are a non-story.
“In November, The Christian Science Monitor focused on the IPCC’s findings on hurricanes, the strength and frequency of which have been linked to global warming ever since former US Vice President Al Gore’s film An Inconvenient Truth made media hay out of Hurricane Katrina. The Monitor’s headline blared: “Climate change warning: brace for hotter heat waves, stronger storms.” Yet, while the IPCC suggests that hurricanes’ maximum wind speeds will most likely increase, it also predicts that the total number of tropical hurricanes may fall, and that extra-tropical hurricanes will most likely decline in frequency, too.

nuclear power plant in Qinshan, China
The IPCC clearly states that hurricane-damage costs have increased steadily because more people, with more expensive property, now live where hurricanes strike. Population, exposure, and vulnerability, not greenhouse gasses, are the main factors underlying future damage as well. Indeed, the IPCC observes that increased hurricane costs “have not been attributed to climate change.” Thus, if we want to avoid future hurricane damage, we need to invest in adaptation. That means better risk management, including stricter building codes and improved wetlands to slow storm surges.
“Considerable evidence does suggest that global warming causes increases in rain, especially heavy rain. That has led many observers to blame global warming for devastating floods in Pakistan, Australia, and Thailand in recent years. But the IPCC tells a different story: the evidence cannot even reliably indicate whether increased precipitation has, in fact, affected the floods’ magnitude and frequency (in UN-speak, “low confidence at the global scale regarding even the sign of these changes”).
“That may sound counter-intuitive. But much more important changes have taken place: in particular, construction of dams and large settlements on floodplains has left rivers nowhere to flood naturally. If we want to help potential flood victims, the evidence clearly shows that we should restore floodplains. Increased precipitation also has positive consequences — most significantly, more fresh water for a thirsty world. Today, about two billion people are water-stressed, meaning that they make do on less than 1,700 cubic meters (60,035 cubic feet) per year. Population growth alone suggests that this number could increase to about three billion towards the end of the century. But more precipitation from global warming will most likely bring the actual number down to about 1.7 billion.
Climate Alarmists?
Bjørn Lomborg wrote:“Extreme weather is often said to be one of the main reasons for taking firm action on global warming. Nowadays, no hurricane or heat wave passes without a politician or activist claiming it as evidence of the need for a global climate deal [Source: Bjørn Lomborg, Project Syndicate, December 13, 2011]
“Scary climate stories rely on a simple narrative: more CO2 means more environmental damage and death — and the only way to address it is to cut carbon emissions. While this makes for a catchy political message, it has the distinct disadvantage of being wrong.
“Global warming will cause certain phenomena, such as heat waves and hurricane wind speeds, to become more extreme, while others, including cold waves and hurricane frequency, will become less so. And, in some cases, such as increasing precipitation, global warming will have both positive and negative effects.
“Of course, none of this means that we should not address climate change by focusing on innovation to make for less costly green energy. The latest IPCC report is important precisely because it illustrates the real environmental problems posed by global warming, without exaggerating them for the sake of a good headline. It provides reliable climate information, and emphasizes that adaptation is essential to improving future generations’ quality of life. It also shows why the latest failure to conclude a comprehensive climate deal is not all bad news. But, when it comes to climate change, the media evidently do not like any other kind.
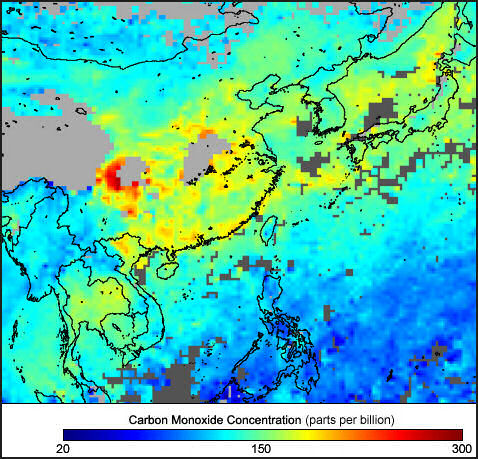
Carbon monoxide concentrations off coast of China,
indicative of carbon dioxide releases
“For the U.S. and China, the climate talks boil down to how much money the rich world will give poorer nations to help them acquire the technology to limit emissions and cope with the droughts, rising sea levels, and other effects caused by those who enjoyed two hundred years of burning cheap fossil fuels. Without sharing costs and technology, it is not at all clear, for instance, that China will invest in the holy grail of climate science: funnelling greenhouse gases underground. The process, known as carbon capture and storage, or C.C.S., is so difficult and expensive that nobody has yet succeeded in using it on a large scale. Like electric cars and coal gasification, C.C.S. would be cheaper to develop in China than in the U.S., but China is not interested in paying for it alone. As long as a Chinese citizen earns less than one-seventh what his counterpart in America earns, China is unlikely to back down on the demand that it should be paid to slow down its economy and invest even more in energy technology. And on that point the sides remain far apart.”
Image Sources: World Meteorological Organization; National Oceanic and Atmospheric Administration (NOAA), Wikimedia Commons
World Meteorological Organization; National Oceanic and Atmospheric Administration (NOAA), Text Sources: New York Times, Washington Post, Los Angeles Times, Times of London, Yomiuri Shimbun, The Guardian, National Geographic, The New Yorker, Time, Newsweek, Reuters, AP, Lonely Planet Guides, Compton’s Encyclopedia and various books and other publications.
Last updated April 2022
