ECONOMIC STATISTICS AND MONEY IN JAPAN
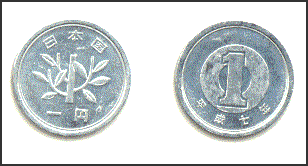
one yen coins Japan had the world’s second largest economy for 42 years from 1968 to 2010. Japan had a $5.47 trillion economy in 2010. Its GDP in 2004 was $4.59 trillion, second after the United States with $11.68 trillion. The same year the GDP of China was $1.3 trillion and the GDP of the 10 Southeast Asian members of ASEAN was $737 billion.
The total economic assets for Japan in 2010 was $17.5 trillion. In 2006 national wealth increased 2.9 percent to ¥2.72 quadrillion. National assets were valued at ¥8.56 quadrillion. In 2007 household assets stood at ¥1.54 quadrillion, company assets (not including financial institutions) reached ¥972 trillion and public sector assets stood at ¥500 trillion.
In the last two decades Japan has lost some lost some of its economic clout. In the late 1980s, Japan accounted of 14 percent of global growth. Today it is worth just 8 percent. In 1988 eight of the top ten companies in term of value and eight of the top ten banks were Japanese. Today none of them are. Land prices in Japan fell for the 20th year in 2011. Prices fell by 3.2 percent and were adversely affected by the March 2011 earthquake and tsunami according to Japan’s land and infrastructure ministry.
Japan ranked ninth in the world in 2011 global competitiveness ranking by the World Economic Forum, 2011, down from sixth the previous year. In 2008, Japan was ranked 22nd in competitiveness behind China by the Geneva-based International Institute for Management Development.
In the early 2000s, Japan ranked 7th in affluence behind Luxembourg, Norway, Sweden, Switzerland, Finland and Austria according to the Organization for Economic Cooperation and Development (OECD) global human development index of 30 developed nations. The United States was 12th and Britain was 16th. Much of Tokyo still looks rich. Sparkling towers continue to go up. Packed bullet trains run on time. Shopping districts are full of people.
By world standards, Japan remains rich and fairly comfortable. Average household income is about $62,000 — slightly less than in the U.S. — based on the latest government data (in 2011). Per capita GDP was $34,252 in 2006, down from $35,922 in 2004.
Websites and Resources
Good Websites and Sources: Statistical Handbook of Japan Economics Chapter stat.go.jp/english/data/handbook ; 2010 Edition stat.go.jp/english/data/nenkan ; News stat.go.jp National Accounts of Japan esri.cao.go.jp/en ; Bank of Japan Statistics boj.or.jp ; Asaho Shimbun Market Trends asahi.com/english/market ; Nation Master nationmaster.com/country/ja-japan/eco-economy ; Economy Watch economywatch.com/economic-statistics/japan ; World Bank Data and Statistics web.worldbank.org ; Office of Japan, U.S. Department of Commerce mac.doc.gov/japan
MONEY IN JAPAN Banknotes on a Bank of Japan site pdf file boj.or.jp/en/type/list/yuko/data/money ; Photos at Japan-Photo Archive japan-photo.de ; Guide to Japanese Money thejapanfaq.com/japanfaq Bank of Japan Currency Museum imes.boj.or.jp ; Latest Exchange Rates: Oanda Oanda ; Xe.com XE
Links in this Website: STATISTICS AND MONEY IN JAPAN Factsanddetails.com/Japan ; MACROECONOMICS IN JAPAN Factsanddetails.com/Japan ; JAPAN INC. AND REFORMS Factsanddetails.com/Japan
Good Websites and Sources on Economics: Ministry of Economy, Trade and Industry meti.go.jp/english ; Ministry of Finance of Japan mof.go.jp/english ; Japan Economy News and Blog japaneconomynews.com ; Japan Economy Watch japanjapan.blogspot.com ; Japan Center for Economic Research jcer.or.jp/eng ; Japan Inc. Economic and Business News japaninc.com ; Google E-Book: Japan in the 21st Century, Environment, Economy and Society (2005) books.google.com/books
China Replaces Japan in 2010 as No. 2 Economy
In the April-June quarter of 2010, China surpassed Japan as the world’s second largest economy behind the United States as it chalked up $1.337 trillion of GDP in that period compared to $1.288 trillion for Japan according to Japanese government statistics. For Japan, the statistic reflected a decline in economic and political power. Japan has stood as the No. 2 economy behind the United States for 42 years. In the 1980s, its rapid growth even led to talk of the Japanese economy’s overtaking that of the United States by 2010.
China’s No.2 status was formalized when data for all of 2010 came in. Japan’s nominal GDP — the total value of goods and services without accounting for inflation — for 2010 amounted to $5.47 trillion, according to Japanese Cabinet Office. That compared with to a $5.88 trillion economy for China. The latest numbers were further evidence of China’s rapid ascent as an economic superpower. Just five years before, China’s gross domestic product was around $2.3 trillion, about half Japan’s. As of 2006, even with the rise of China, India and South Korea, it accounted for nearly half of Asia’s GNP.
Being surpassed by China as the world’s No. 2 economy is not all that significant when you consider that China’s population is ten times larger than that of Japan and thus on a per capita basis the Chinese economy is only on tenth as large as the Japanese economy. The Japanese economy is still around 56 times bigger than the one in Thailand. Overall China’s growth is good news for Japan as it means there is a huge market for Japan just offshore. India is expected to surpass Japan and have the third largest economy in the world, putting Japan in forth, by 2020.
Japan’s Chief Cabinet Secretary Yukio Edano said, “We are not engaging in economic activity to vie for ranking but to enhance people’s lives. From that point of view, we welcome China’s economic advancement as a neighboring country....the important thing is to incorporate such vitality to make Japan’s economy grow. Senior Mitsui executive, Osamu Koyama, told Roger Chen of the New York Times: “We’ve been telling people for years we were No. 2, ever since we overtook Germany, and it hasn’t given us much benefit. “
According to the New York Times, “While Japan’s economy is now mature and its population quickly aging, China is in the throes of urbanization and industrialization. Still, China’s per-capita income is about $3,600, less than one-tenth that of the United States or Japan... Japan’s economy, however, has benefited from China’s rapid growth, initially as businesses shifted production there to take advantage of lower costs, and as local incomes rose, by tapping an increasingly lucrative market for Japanese goods.”
An editorial in The Strait Times read: “The Japanese can still hold their heads high. No amount of moaning at being overtaken by China would negate the fact that theirs remains a model rich nation others want to emulate, and that it is probably among the most civilized of societies. The latter category counts in evaluating human progress. The societal coarsening that has blighted China with the onset of sudden riches is a serious deficiency that can only get worse. And the Japanese economy remains innovative in spotting trends. Its brands are so strong Toyota has not lost the confidence of overseas car buyers despite a spate of production flaws. Japan has lots more to offer and its people need not think of the country as being in rapid decline.”
Strong Yen Pushes Japan's Per-Capita GDP Higher
Japan's per-capita gross domestic product in 2010 stood at $42,983, advancing to 14th in the rank of developed economies from 16th the previous year, helped by the sharp rise of the yen against the U.S. dollar, the government said. The list of 34 OECD countries by per-capita GDP was topped by Luxembourg, which logged $105,313, while Norway ranked second with $84,473. The United States was eighth with $46,588. The per-capita GDP of China, not a member of the OECD, was $4,430. [Source: Kyodo, December 27 2011]
“Total nominal GDP stood at $5.50 trillion, taking up a global share of 8.7 percent and staying flat from 2009. China, at 9.4 percent, replaced Japan as the world's second-biggest economy after the United States, at 22.9 percent, the Japanese Cabinet Office said. Japan's per-capita GDP has grown only about 11 percent since 1994, when it ranked second in the list of the Organization for Economic Cooperation and Development, as the country's economy has been mired in chronic deflation. In 2010, though, the amount was the biggest ever for the country because it was stated in dollars.
In December 2012, Jiji Press reported: Japan remained 14th in dollar-based per-capita nominal gross domestic product in 2011 among the 34 member countries of the Organization for Economic Cooperation and Development, the Cabinet Office has said. In 2011, Japan's per-capita GDP was 46,192 dollars, hitting a record high for the second straight year thanks to the yen's appreciation. Luxembourg remained top with 114,081 dollars, followed by Norway with 99,063 dollars and Switzerland with 83,966 dollars. The United States fell from eighth to 12th with 48,043 dollars. [Source: Jiji Press, December 27, 2012]
Japan's total nominal GDP came to 5.9 trillion dollars in 2011, marking an all-time high for the second consecutive year. But the country's share of global GDP fell 0.3 percentage point from 2010 to 8.4 percent. The United States stayed on top with a total nominal GDP of 15 trillion dollars.
Growth, Inflation and Unemployment in Japan
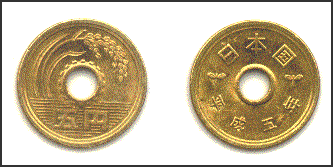
five yen coins Growth was 2.7 percent in 2005 and was 2.1 percent in 2006 and 2.1 percent in 2007. The expansion was led primarily by robust domestic demand and trade with China.
The Japanese economy shrunk 3.3 percent in fiscal 2008 (between April 2008 and March 2009) due to the global financial crisis. In February 2009, the IMF said that Japan was in “deep recession.” GDP declined 12.1 percent in the October to December quarter in 2008, the biggest contraction in Japan since 1974 when it was in the midst of oil crisis, and crashed 14.2 percent in the January to March 2009 quarter, the steepest fall on record.
Low growth figures aren’t as bad in Japan as other countries because the population is hardly growing — even shrinking — and most people already enjoy a relatively high standard of living.
Japan's unemployment rate has been running 4 percent to 5 percent, about double the rate in the go-go 1980s, but still just half of the current U.S. rate of 9.6 percent. The unemployment rate was 4.7 percent in July 2011. It fell to 4.3 percent in August, analysts said, due contractions in the labor force, The figure was not necessarily as good sign as some interpreted it to means that many people had temporarily given up in their job search. Unemployment stood at 4.6 percent in February 2011. Vacancies were up but 240,000 people were still unemployed. Unemployment was 4.9 percent in January 2011, 5.1 percent in October 2010 and 4.9 percent in February 2010.
Unemployment reached 4.4 percent in December 2008 and 4.8 percent in March 2009 and 5.2 percent in May 2009 during the global financial crisis. The May 2009 ratio of jobs to job seekers of 9.44 was the lowest since data for that figure started being collected in 1963. Unemployment was 4.4 percent in June 2005 and 4.1 percent in August 2006 and 4 percent in February 2007. The unemployment rate fell to 3.6 percent in August 2007, the lowest level since February 1998.
Inflation in Japan is minimal: usually less than two percent. In July 2008, consumer prices rose 2.4 percent, the highest in 16 years. In July and August 2008 wholesale prices rose 7.3 and 7.2 percent respectively, the highest rates since 1981, mainly due to high energy and material costs. Prices also jumped for basic things like milk, cooking oil, noodles brought in part by demand for these goods and basic commodities by China. Inflation was brought by the global financial crisis in 2008 and 2009.
National Debt and Government Bonds in Japan
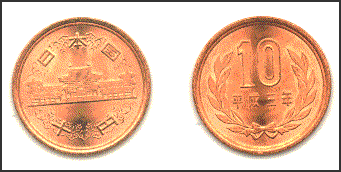
10 yen coins The Japanese government is the world’s largest debtor. It had a $6.3 trillion debt in December 2005, compared to $4 trillion in the United States.
In November 2009, government debt reached ¥864 trillion (about $9.5 trillion). It reached a record ¥838 trillion at the beginning of 2008. By some calculations the debt continues to rise by about $100,000 every minute.
The national debt in 2007 was an astounding 170 percent of GDP, the largest by far of any developed nation. The debt market is helped by government policies that keep interest rates relatively low.
The Japanese government bond market is the world’s largest. It is also one of the least international. Roughly 96 percent of government securities are domestically held so there is little worry about capital flight.
Foreign Reserves in Japan
Foreign exchange reserves reached a record high of $1.3 trillion in November 2011. They reached a record $1.22 trillion in August 2011, increasing 5.9 percent from the previous month, after market intervention by the Japanese government to try and bring down the value of the yen. Japan’s foreign reserves were $1.05 trillion February 2010, less than half of the $2.85 trillion in foreign reserves of China. Foreign reserves hit $1.07 trillion in November 2009, , rising from around $200 billion in 1996. Foreign reserves reached $1.02 trillion in March 2008, the first time they topped $1 trillion.
In 2009, Japan reclaimed the position of the largest holder of U.S. securities with $798.8 billion of them, compared to $755.4 billion for China . In September 2008, China surpassed Japan as the top holder of U.S. Treasury securities with China possessing about $585 billion in U.S. Treasury holdings, more than double what it had in 2005, and Japan having $573.3 billion, down from a peak of $699 billion in August 2004.
Japan, like China, could cause great damage to the U.S. economy were it to suddenly unload all its U.S. Treasury notes. But for Japan to do so would be against their self interest. They have so much American debt that to engage in a large sell off would trigger a panic, causing the value of the treasury security they hold to plummet in value before they could be sold. See China, Economics, Macroeconomics
Between 2003 and 2004 the Bank of Japan engaged in massive yen selling and dollar buying to stop the steep appreciation of the yen. As a result the Japanese government accumulated a high amount of dollar based assets. In 2004, Japan had $817 billion in reserves of foreign currency, the most in the world.
Japanese foreign reserves consist mainly of securities and deposits denominated in foreign currencies. About 90 percent of Japan’s foreign currency reserves are dollar-bases assets, including U.S. Treasury bonds and notes which finance the U.S. debt. The yields from these notes are 4 percent a year, with profits taken by Japan often topping ¥3 trillion a year. There are problems though. As the value of the dollar declines so too does the value of Japan’s foreign reserves.
Japan holds more foreign assets than any other country. It held about $6 trillion in foreign assets in 2007, the most of any country for the 17th straight year. Japanese possesses so many foreign assets in part because yields on investments and assets in Japan are so low.
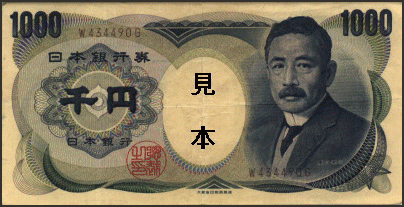
front of old 1,000 yen banknote
Money and Banknotes in Japan
The monetary unit in Japan is the yen. In the old days 100 “sen” was equal to one yen and 10 “rin” was equal to one sen.
Chinese money was introduced to Japanese about 1,500 years ago. The first Japanese coins were minted from copper and silver in A.D. 708. Paper money was introduced in 1661. The oldest minted coins were unearthed at the ancient site of Fujiwarakyu, the ancient capital from 694 to 710, in Kashihara, Nara.
Japanese banknotes contain a watermark (a picture visible when held up to a light) with an image of the person pictured on the banknote and braille lettering (small rings inset into the bottom left corners of each bill, with A for the ¥1,000 note, B for the ¥5,000 note and C for the ¥10,000 note). Each denomination has a different color and slightly different size.
New bills introduced in November 2004 contain new anti-counterfeiting measures technologies such as: 1) holographic imaging, which change color when viewed at different angles, making it possible to tell at a glance if the bill is genuine; 2) colored and bar pattern watermarks; 3) special designs with letterings that becomes visible when viewed at an angle,; 4) special luminous ink that shows up under ultraviolet light; 5) microsized letters that can be seen with a magnifying glass and are too small to be replicated with a copier or printer; and 6) solid ink that has a slight relief.
The words "NIPPON GINGKO" are printed in micro lettering in the scroll decorations of the ¥10,000 note under the ¥10,000 mark in the top corners of the front of the bill and at the very bottom of the back. These are a countermeasure against advanced color copiers. A red chop of the president of the Bank of Japan on the front face glows orange when seen under ultra violent light.
Counterfeiting has become a problem in resent years. In 1998 there were only 80 cases of forged yen notes detected. In the first half of 2004, 14,000 were detected. Most of the counterfeit notes were 1,000 yen notes found in vending machines. Vending machines had to be altered to reject the counterfeit bills.
Sun Media, a photo engraving company in Kobe, has developed what it calls an easy surefire way to identify fake bills. Known as “Magic Sheet,” it is a transparent polyester resin sheet that is placed over banknotes, Genuine bills reveal moire patters — the visual effect that occurs when two sets of lines or patterns are overlaid. Fake bills do not produce the moire patterns.
back of old 1,000 yen banknote
People and Pictures on Japanese Banknotes
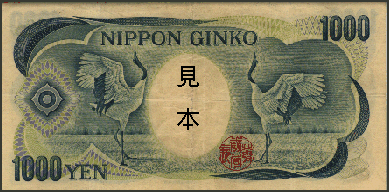
The new ¥1,000 bank note, introduced in 2004, contains a picture of Hideyo Noguchi (1876-1928), a biologist whose main claim to fame was discovering the bacteria that causes syphilis . On the back are Mt. Fuji and cherry blossoms. The old ¥1,000 bank note contains a picture of Soseki Natsume (1867-1916), an early 20th century novelist who wrote classics like “I Am a Cat” and “Kokoro On the back are two Japanese cranes.
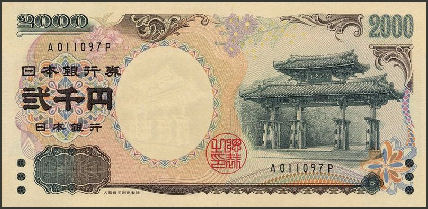
The ¥2,000 bank note features an Okinawan gate on one side and Murasaki Shikibu, the author the “Tale of Genji”, and a scene from the book on the back. If you tilt a ¥2,000 bank note you can see "2000" written in the lower, left-hand corner. If you tilt the reverse side of a ¥2,000 bank note you can see "NIPPON" written in the upper, right-hand corner. The ¥2,000 bank note proved to be very unpopular, in part because vending machines and ATMs would not take it.
The new ¥5,000 bank note, introduced in 2004, contains a picture of novelist Ichiyo Higuchi (1872-1896). In Japan, she is known for her book on the unhappy, restricted lives of Japanese women. On the back is the calligraphic work “Kakitsubata-zu” by Ogata Korin (1658-1716). The old ¥5,000 bank note featured a picture of Nitobe Inazi (1862-1933), an educator, civil servant and writer who wrote many works in English, attended the Versailles Peace Conference and was an under-secretary of the League of Nations. On the back is a picture of Mt. Fuji.
The old ¥10,000 bank note features a picture of Fukuzawa Yukichi (1835-1901), an educator and founder of Keio University. He is considered a major Meiji period figure and modernizer of Japan. On the back is a Japanese pheasant. The new ¥10,000 bank note, introduced in 2004, contains a picture of picture of Fukuzawa on the front but on the back are a pair of phoenix statues at Byodoin statues in Kyoto prefecture.
back of relatively uncommon 2,000 yen banknote
Japanese Coins
There are six coins. 1) The ¥1 coin is made of aluminum and features a stylized sapling and weighs only one gram. 2) The ¥5 coin is made of brass, has a hole in the middle and shows rice stalks. 3) The ¥10 coin is made of bronze and features a picture of Phoenix Hall at Byodoin in Uji, Kyoto Prefecture.
4) The ¥50 coin is made of copper and nickel and has a chrysanthemum motif and a hole in the middle. 5) the ¥100 coin is made of copper and nickel and contains an image of a cherry blossom. 6) The ¥500 coin is made of copper, nickel and zinc and features a pavlownia design. It is the only coin that has writing in the edge (it says NIPPON 500).
Korean 500 won coins (equal to about ¥50) and Hungarian 50 florin coins (equal to about ¥20) can be doctored to pass as ¥500 coins in vending machines. In response to this some zinc was added to ¥500 coins. The zinc gives the coins a slightly yellowish sheen and have been given an electro-casting that can detected by devises installed in vending machines.
For more images of coins and banknotes see the Macroeconomics article
Image Sources: markun.cs.shinshu-u.ac.jp except 2,000 note Wikipedia
Text Sources: New York Times, Washington Post, Los Angeles Times, Daily Yomiuri, Times of London, Japan National Tourist Organization (JNTO), National Geographic, The New Yorker, Time, Newsweek, Reuters, AP, Lonely Planet Guides, Compton’s Encyclopedia and various books and other publications.
Last updated January 2013
