CHICKEN INDUSTRY

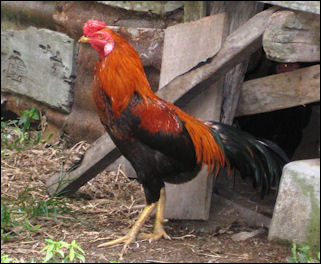
chicken in Malaysia Chicken is the most commonly eaten meat in America. Globally, it’s second behind pork, but it’s catching up fast. Perhaps soon, humans will eat more chicken than any other meat. Globally, more than 65.8 billion chickens are eaten every year. Modern chickens raised for food typically live between 33 and 81 days, [Sources: Allison Robicelli, Takeout, June 11, 2021; Zach Zorich, Archaeology magazine, March-April 2019; [Source NPR, 2015]
Industrially-raised broiler chickens live for eight weeks and have their beaks cut of with a hot knife so they don’t peck and cannibalize one other. Chicken feed in the United States often contains fish meal from Asia. The use of antibiotics is high in the chicken industry.
Chickens are often slaughtered before their chest muscles are fully developed. The result is less tasty “PSE”—“pale, soft, exudative” — meat. Scientists have developed a breed of featherless chickens, known as naked chicken, that save producers the cost of removing the feathers and have less fat the other chickens.
Industrially-raised egg-laying chickens are packed together indoors with about a half dozen other birds in cages so small the chickens cannot extend their wings and the floor is only large enough for a page of a magazine to cover. Some try to cannibalize one another. Others rub they themselves against their cages until their feathers fall out and their skin bleeds. About 10 percent die. Those that survive are deprived of food and water to get them to lay larger eggs and starved before they die to induce one last bout of stress-induced egg-laying.
In the late 2000s, cage-free chickens and cage-free hens became all the rage in the United States. Sometimes the term “free-range” is used instead of “cage-free.” The term “free range” can be misleading though. Many free range chickens never see the light of day as the sheds they live are often too crowded for them to make their way to opening to get outside.
See Separate Article: JUNGLE FOWL (CHICKENS) factsanddetails.com
World’s Top Chicken Exporting and Importing Countries
World’s Top Exporters of Chickens (2020): 1) Germany: 433616 tonnes; 2) Netherlands: 269877,000 Head; 3) Germany: 256019,000 Head; 4) Belgium: 126208,000 Head; 5) Belgium: 125225 tonnes; 6) France: 124864 tonnes; 7) Hungary: 116879,000 Head; 8) Netherlands: 99102 tonnes; 9) France: 97918,000 Head; 10) Czechia: 96529,000 Head; 11) Poland: 69535,000 Head; 12) Denmark: 61051,000 Head; 13) Malaysia: 56491,000 Head; 14) United States: 51896,000 Head; 15) Slovakia: 50004,000 Head; 16) Serbia: 37262,000 Head; 17) Romania: 35512 tonnes; 18) Denmark: 35383 tonnes; 19) Slovakia: 33632 tonnes; 20) Turkey: 32954 tonnes [Source: FAOSTAT, Food and Agriculture Organization (U.N.), fao.org]
World’s Top Exporters (in value terms) of Chickens (2020): 1) Germany: US$504633,000; 2) Netherlands: US$313790,000; 3) United States: US$227513,000; 4) France: US$186102,000; 5) United Kingdom: US$180078,000; 6) Belgium: US$155737,000; 7) Malaysia: US$153489,000; 8) Hungary: US$106232,000; 9) Denmark: US$87570,000; 10) Brazil: US$77891,000; 11) Spain: US$77853,000; 12) Czechia: US$53939,000; 13) Turkey: US$46086,000; 14) Romania: US$33607,000; 15) Slovakia: US$32420,000; 16) New Zealand: US$31927,000; 17) Poland: US$29691,000; 18) Thailand: US$19472,000; 19) Austria: US$16453,000; 20) Sweden: US$14369,000
World’s Top Importers of Chickens (2020): 1) Netherlands: 669455 tonnes; 2) Netherlands: 410911,000 Head; 3) Belgium: 213713 tonnes; 4) Germany: 148774,000 Head; 5) Belgium: 142038,000 Head; 6) Romania:114664,000 Head; 7) Ukraine: 95279,000 Head; 8) Poland: 93128,000 Head; 9) Poland: 89596 tonnes; 10) Germany: 88277 tonnes; 11) Slovakia: 66159,000 Head; 12) Hungary: 47089 tonnes; 13) Singapore: 46109,000 Head; 14) Canada: 36093,000 Head; 15) Austria: 34806 tonnes; 16) Spain: 33532,000 Head; 17) Bosnia and Herzegovina: 33376,000 Head; 18) Afghanistan: 31341,000 Head; 19) Syria: 27575 tonnes; 20) Hungary: 24734,000 Head: [Source: FAOSTAT, Food and Agriculture Organization (U.N.), fao.org]
World’s Top Importers (in value terms) of Chickens (2020): 1) Netherlands: US$685167,000; 2) Belgium: US$200401,000; 3) Germany: US$167632,000; 4) Singapore: US$147930,000; 5) Poland: US$96278,000; 6) Romania: US$60038,000; 7) Hungary: US$60000,000; 8) Canada: US$59643,000; 9) Ukraine: US$56032,000; 10) Austria: US$43446,000; 11) China: US$35721,000; 12) France: US$35067,000; 13) Slovakia: US$35008,000; 14) Spain: US$34991,000; 15) Indonesia: US$31843,000; 16) Syria: US$29703,000; 17) Algeria: US$26988,000; 18) Thailand: US$25096,000; 19) Portugal: US$23600,000; 20) Vietnam: US$22216,000
World’s Top Chicken Meat Producing Countries
World’s Top Producers of Chicken Meat (2020): 1) United States: Chicken Meat: 20490251 tonnes; 2) China: Chicken Meat: 15143887 tonnes; 3) Brazil: 13787480 tonnes; 4) Russia: 4576733 tonnes; 5) Indonesia: 3707876 tonnes; 6) Mexico: 3578694 tonnes; 7) India: 3550636 tonnes; 8) Japan: 2347667 tonnes; 9) Argentina: 2219238 tonnes; 10) Iran: 2219155 tonnes; 11) Poland: 2200280 tonnes; 12) Turkey: 2138451 tonnes; 13) South Africa: 1873238 tonnes; 14) United Kingdom: 1784000 tonnes; 15) Thailand: 1782014 tonnes; 16) Peru: 1723497 tonnes; 17) Pakistan: 1657000 tonnes; 18) Colombia: 1619784 tonnes; 19) Malaysia: 1532028 tonnes; 20) Myanmar: 1500000 tonnes [Source: FAOSTAT, Food and Agriculture Organization (U.N.), fao.org. A tonne (or metric ton) is a metric unit of mass equivalent to 1,000 kilograms (kgs) or 2,204.6 pounds (lbs). A ton is an imperial unit of mass equivalent to 1,016.047 kg or 2,240 lbs.]
World’s Top Exporters of Chicken Meat (2020): 1) Brazil: 3899503 tonnes; 2) United States: 3546799 tonnes; 3) Netherlands: 1169579 tonnes; 4) Poland: 941233 tonnes; 5) Turkey: 522322 tonnes; 6) Belgium: 458749 tonnes; 7) Ukraine: 433117 tonnes; 8) United Kingdom: 377906 tonnes; 9) Thailand: 344044 tonnes; 10) Germany: 254316 tonnes; 11) France: 221228 tonnes; 12) Belarus: 192540 tonnes; 13) Argentina: 179460 tonnes; 14) Russia: 178338 tonnes; 15) China: 161083 tonnes; 16) Spain: 150266 tonnes; 17) Chile: 129299 tonnes; 18) Hungary: 118542 tonnes; 19) Italy: 92131 tonnes; 20) Canada: 91340 tonnes

cockfight cocks Top Chicken-Meat-Producing Countries in 2008 (Production, $1000, Production, metric tons, FAO): 1) United States of America, 18989434 , 16280100; 2) China, 12957495 , 11108773; 3) Brazil, 11948791 , 10243987; 4) Mexico, 3004190 , 2575565; 5) Russian Federation, 2318678 , 1987859; 6) Iran (Islamic Republic of), 1830434 , 1569276; 7) Indonesia, 1775825 , 1522458; 8) Japan, 1592220 , 1365049; 9) United Kingdom, 1508098 , 1292929; 10) Argentina, 1352114 , 1159200; 11) Turkey, 1266757 , 1086683; 12) Spain, 1206571 , 1042777; 13) Colombia, 1191460 , 1021468; 14) Thailand, 1187831 , 1018356; 15) France, 1183916 , 1015000; 16) Canada, 1166420 , 1000000; 17) Malaysia, 1162769 , 996870; 18) South Africa, 1135679 , 973645; 19) Peru, 1025395 , 879096; 20) Australia, 938247 , 804382
World’s Top Chicken Meat Exporting Countries
World’s Top Exporters (in value terms) of Chicken Meat (2020): 1) Brazil: US$5481525,000; 2) United States: US$3411680,000; 3) Netherlands: US$2338837,000; 4) Poland: US$1628003,000; 5) Thailand: US$902505,000; 6) Belgium: US$796166,000; 7) Ukraine: US$557864,000; 8) Turkey: US$530518,000; 9) Germany: US$522534,000; 10) France: US$441213,000; 11) China: US$438498,000; 12) United Kingdom: US$322382,000; 13) Chile: US$307882,000; 14) Belarus: US$290174,000; 15) Spain: US$263025,000; 16) Russia: US$261995,000; 17) Argentina: US$246749,000; 18) Hungary: US$200647,000; 19) Italy: US$194403,000; 20) Austria: US$175863,000
World’s Top Exporters of Canned Chicken Meat (2020): 1) Thailand : 567969 tonnes; 2) China: 256792 tonnes; 3) Germany: 201548 tonnes; 4) Poland: 157652 tonnes; 5) Netherlands: 127979 tonnes; 6) United States: 102722 tonnes; 7) Brazil: 95619 tonnes; 8) Belgium: 68661 tonnes; 9) Denmark: 65739 tonnes; 10) France: 59654 tonnes; 11) Hungary: 48920 tonnes; 12) Canada: 37672 tonnes; 13) United Kingdom: 30306 tonnes; 14) Spain: 29297 tonnes; 15) Turkey: 27590 tonnes; 16) Malaysia: 26132 tonnes; 17) Austria: 23098 tonnes; 18) Ireland: 22696 tonnes; 19) Italy: 21333 tonnes; 20) Chile: 19080 tonnes
World’s Top Exporters (in value terms) of Canned Chicken Meat (2020): 1) Thailand: US$2566746,000; 2) China: US$1049681,000; 3) Germany: US$839916,000; 4) Netherlands: US$556020,000; 5) Poland: US$505596,000; 6) Belgium: US$325793,000; 7) France: US$276172,000; 8) United States: US$270075,000; 9) Brazil: US$264467,000; 10) Denmark: US$247209,000; 11) Canada: US$243552,000; 12) Hungary: US$180509,000; 13) Ireland: US$142646,000; 14) United Kingdom: US$141720,000; 15) Austria: US$105200,000; 16) Spain: US$103676,000; 17) Malaysia: US$102054,000; 18) Italy: US$83755,000; 19) United Arab Emirates: US$75778,000; 20) Romania: US$60540,000
World’s Top Chicken Meat Importing Countries

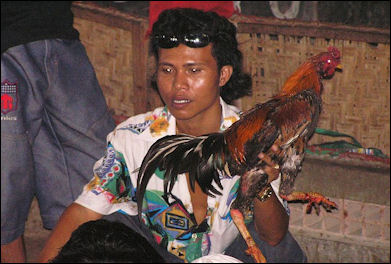
Cock and owner, Bali World’s Top Importers of Chicken Meat (2020): 1) China: 1527148 tonnes; 2) Mexico: 881419 tonnes; 3) Saudi Arabia: 617402 tonnes; 4) Japan: 535031 tonnes; 5) United Arab Emirates: 474939 tonnes; 6) Germany: 470860 tonnes; 7) Hong Kong: 451454 tonnes; 8) Iraq: 428986 tonnes; 9) South Africa: 398923 tonnes; 10) United Kingdom: 368593 tonnes; 11) France: 367112 tonnes; 12) Netherlands: 363525 tonnes; 13) Philippines: 312257 tonnes; 14) Ghana: 283829 tonnes; 15) Taiwan: 251921 tonnes; 16) Cuba: 249546 tonnes; 17) Vietnam: 231848 tonnes; 18) Russia: 217053 tonnes; 19) Angola: 215928 tonnes; 20) Belgium: 204128 tonnes [Source: FAOSTAT, Food and Agriculture Organization (U.N.), fao.org]
World’s Top Importers (in value terms) of Chicken Meat (2020): 1) China: US$3447418,000; 2) United Kingdom: US$1153228,000; 3) Saudi Arabia: US$1114310,000; 4) Germany: US$1105437,000; 5) Japan: US$1098688,000; 6) France: US$963501,000; 7) Hong Kong: US$853446,000; 8) Netherlands: US$761502,000; 9) Mexico: US$731325,000; 10) United Arab Emirates: US$654084,000; 11) Iraq: US$536141,000; 12) Belgium: US$370316,000; 13) Russia: US$304059,000; 14) Ghana: US$284907,000; 15) Kuwait: US$283212,000; 16) Vietnam: US$282975,000; 17) Cuba: US$277055,000; 18) Singapore: US$272035,000; 19) Canada: US$266367,000; 20) South Korea: US$260410,000
Exporters and Importers of Chicken Liver and Chicken Offals
Offals are the intestines and internal organs of an animal consumed as food.
World’s Top Exporters of Chicken Liver and Offals (2020): 1) Poland: 286992 tonnes; 2) Netherlands: 244936 tonnes; 3) Russia: 107673 tonnes; 4) Sweden: 52594 tonnes; 5) United Kingdom: 47255 tonnes; 6) Germany: 44538 tonnes; 7) Belgium: 33139 tonnes; 8) Hungary: 21336 tonnes; 9) Ireland: 15929 tonnes; 10) Denmark: 14567 tonnes; 11) Spain: 11306 tonnes; 12) France: 10157 tonnes; 13) Italy: 8688 tonnes; 14) Austria: 8330 tonnes; 15) South Africa: 6199 tonnes; 16) Greece: 3716 tonnes; 17) Oman: 3514 tonnes; 18) Finland: 2677 tonnes; 19) Latvia: 2174 tonnes; 20) Romania: 2095 tonnes [Source: FAOSTAT, Food and Agriculture Organization (U.N.), fao.org]
World’s Top Exporters (in value terms) of Chicken Liver and Offals (2020): 1) Poland: US$370913,000; 2) Netherlands: US$173088,000; 3) Russia: US$151662,000; 4) Germany: US$18974,000; 5) United Kingdom: US$18716,000; 6) Belgium: US$16162,000; 7) Oman: US$14265,000; 8) Denmark: US$11780,000; 9) Sweden: US$9402,000; 10) Italy: US$9351,000; 11) Spain: US$7582,000; 12) Ireland: US$7457,000; 13) Hungary: US$7290,000; 14) Norway: US$6160,000; 15) South Africa: US$5971,000; 16) France: US$5542,000; 17) Austria: US$4243,000; 18) United Arab Emirates: US$3062,000; 19) Greece: US$1959,000; 20) Czechia: US$1723,000. [Source: FAOSTAT, Food and Agriculture Organization (U.N.), fao.org]
World’s Top Importers of Chicken Liver and Offals (2020): 1) Philippines: 211276 tonnes; 2) Netherlands: 174878 tonnes; 3) Democratic Republic of the Congo: 75274 tonnes; 4) South Africa: 61075 tonnes; 5) Germany: 37429 tonnes; 6) Denmark: 23818 tonnes; 7) Austria: 22041 tonnes; 8) France: 19942 tonnes; 9) Belgium: 18317 tonnes; 10) Honduras: 17391 tonnes; 11) Cuba: 17256 tonnes; 12) Poland: 14852 tonnes; 13) Dominican Republic: 14472 tonnes; 14) Lesotho: 13822 tonnes; 15) Greece: 13364 tonnes; 16) Tajikistan: 10808 tonnes; 17) Hong Kong: 10702 tonnes; 18) Hungary: 10373 tonnes; 19) United Kingdom: 10300 tonnes; 20) Romania: 8500 tonnes [Source: FAOSTAT, Food and Agriculture Organization (U.N.), fao.org]
World’s Top Importers (in value terms) of Chicken Liver and Offals (2020): 1) Philippines: US$212034,000; 2) Netherlands: US$86606,000; 3) United Arab Emirates: US$40716,000; 4) Democratic Republic of the Congo: US$36346,000; 5) South Africa: US$31056,000; 6) Germany: US$24765,000; 7) Dominican Republic: US$24251,000; 8) Tajikistan: US$23459,000; 9) Lesotho: US$22747,000; 10) Denmark: US$20179,000; 11) Honduras: US$19759,000; 12) Cuba: US$18359,000; 13) France: US$14960,000; 14) Belgium: US$14049,000; 15) Hong Kong: US$12336,000; 16) Poland: US$10944,000; 17) Saint Lucia: US$10506,000; 18) Romania: US$8523,000; 19) Hungary: US$7373,000; 20) Russia: US$6251,000
World’s Top Chicken Egg Producing Countries
World’s Top Producers of Chicken Eggs in the Shell (2020): 1) China: 29824800 tonnes; 2) United States: 6607722 tonnes; 3) India: 6292000 tonnes; 4) Indonesia: 5044395 tonnes; 5) Brazil: 3260859 tonnes; 6) Mexico: 3015959 tonnes; 7) Japan: 2632882 tonnes; 8) Russia: 2492190 tonnes; 9) Turkey: 1236754 tonnes; 10) France: 984638 tonnes; 11) Colombia: 982897 tonnes; 12) Pakistan: 946251 tonnes; 13) Ukraine: 924325 tonnes; 14) Spain: 912532 tonnes; 15) Argentina: 873000 tonnes; 16) Germany: 839654 tonnes; 17) Malaysia: 806877 tonnes; 18) United Kingdom: 774000 tonnes; 19) Iran: 755570 tonnes; 20) South Korea: 734528 tonnes
World’s Top Producers (in terms of value) of Chicken Eggs in the Shell (2019): 1) China: Int.$35393317,000 ; 2) United States: Int.$8342444,000 ; 3) India: Int.$7183430,000 ; 4) Indonesia: Int.$5912656,000 ; 5) Brazil: Int.$3928381,000 ; 6) Mexico: Int.$3669187,000 ; 7) Japan: Int.$3283522,000 ; 8) Russia: Int.$3099187,000 ; 9) Turkey: Int.$1546935,000 ; 10) Ukraine: Int.$1186043,000 ; 11) Pakistan: Int.$1113829,000 ; 12) Colombia: Int.$1073427,000 ; 13) Malaysia: Int.$1036228,000 ; 14) Argentina: Int.$1032424,000 ; 15) Spain: Int.$1008714,000 ; 16) United Kingdom: Int.$991376,000 ; 17) France: Int.$977781,000 ; 18) Germany: Int.$949259,000 ; 19) South Korea: Int.$914669,000 ; 20) Iran: Int.$900075,000
Top Hen-Egg Producing Countries in 2008 (Production, $1000; Production, metric tons,FAO): 1) China, 19298017 , 22749200; 2) United States of America, 4012061 , 5338700; 3) India, 2609342 , 3060000; 4) Japan, 2152466 , 2554000; 5) Mexico, 1937843 , 2337215; 6) Russian Federation, 1770081 , 2118500; 7) Brazil, 1302133 , 1844670; 8) Indonesia, 874259, 1122617; 9) France, 766845 , 946800; 10) Ukraine, 700441 , 855200; 11) Turkey, 673454 , 824419; 12) Spain, 651991 , 800000; 13) Germany, 637838 , 789600; 14) Italy, 597202 , 724000; 15) Iran (Islamic Republic of), 557435 , 727000; 16) Netherlands, 500997 , 627000; 17) Poland, 468701 , 581740; 18) Nigeria, 465585 , 552800; 19) United Kingdom, 461318 , 600102; 20) Republic of Korea, 447951 , 566050;
World’s Top Chicken Egg Exporting Countries
World’s Top Exporters of Chicken Eggs in the Shell (2020): 1) Netherlands: 415326 tonnes; 2) Turkey: 217908 tonnes; 3) Poland: 198041 tonnes; 4) United States: 159290 tonnes; 5) Uzbekistan: 125260 tonnes; 6) Spain: 124325 tonnes; 7) Germany: 118438 tonnes; 8) Malaysia: 113755 tonnes; 9) Belgium: 93553 tonnes; 10) China: 72864 tonnes; 11) Belarus: 37239 tonnes; 12) France: 33255 tonnes; 13) Russia: 30046 tonnes; 14) Bulgaria: 22586 tonnes; 15) Latvia: 21527 tonnes; 16) Portugal: 18330 tonnes; 17) Japan: 18120 tonnes; 18) United Kingdom: 17962 tonnes; 19) Czechia: 17803 tonnes; 20) India: 16143 tonnes [Source: FAOSTAT, Food and Agriculture Organization (U.N.), fao.org]
World’s Top Exporters (in value terms) of Chicken Eggs in the Shell (2020): 1) Netherlands: US$738046,000; 2) United States: US$430773,000; 3) Germany: US$264930,000; 4) Poland: US$261863,000; 5) Turkey: US$256130,000; 6) Spain: US$200060,000; 7) Belgium: US$182987,000; 8) United Kingdom: US$124674,000; 9) Malaysia: US$123143,000; 10) China: US$105438,000; 11) France: US$80449,000; 12) Czechia: US$46746,000; 13) Bulgaria: US$43455,000; 14) Japan: US$42941,000; 15) Brazil: US$42195,000; 16) Hungary: US$36768,000; 17) Portugal: US$36239,000; 18) Belarus: US$34117,000; 19) Russia: US$30793,000; 20) Latvia: US$28028,000
Image Sources: Wikimedia Commons
Text Sources: New York Times, Washington Post, Los Angeles Times, Times of London, Yomiuri Shimbun, The Guardian, National Geographic, The New Yorker, Time, Newsweek, Reuters, AP, Lonely Planet Guides, Compton’s Encyclopedia and various books and other publications.
Last updated May 2024
