CLIMATE CHANGE (GLOBAL WARMING)
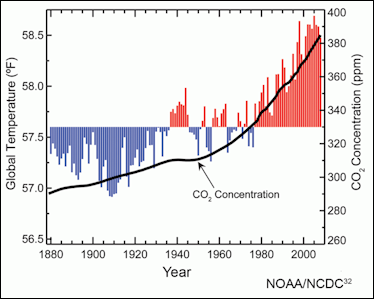
Atmospheric carbon dioxide concentrations
and global annual average temperatures
over the years 1880 to 2009 Global warming and climate change refer to the warming of the entire earth by the greenhouse effect (See Below). Global warming and climate change often refers to the heating of the Earth through an increase of warming gases caused by human activity.
Consequences of global warming potentially include changing climatic patterns, turning productive agricultural land into desert, melting glaciers and ice caps, lowering freshwater supplies, raising the level of the oceans, damaging coral reefs, and flooding coastal cities. Climate change can make extreme weather — storms, wildfires, floods and droughts — worse and more frequent and causes oceans to get more acidic, studies show. There are also health effects, including heat deaths and increased pollen.
Earth's average temperature has risen more than 1.2 degrees Celsius (2 degrees Fahrenheit) since the late 19th century. Scientists worry that in a future worst case scenario: 1) the Amazon rainforest would becomes a savanna; 2) coral reefs would die on a massive scale; 3) the ice sheets would melt; 4) Atlantic Ocean circulation could stop; and 5) the great boreal 'snow forest' would disappear.
According to NASA: Tracking global temperature trends provides a critical indicator of the impact of human activities — specifically, greenhouse gas emissions — on our planet. Rising temperatures are causing phenomena such as loss of sea ice and ice sheet mass, sea level rise, longer and more intense heat waves, and shifts in plant and animal habitats. Understanding such long-term climate trends is essential for the safety and quality of human life, allowing humans to adapt to the changing environment in ways such as planting different crops, managing our water resources and preparing for extreme weather events.
In the long term, parts of the globe are also warming faster than others. Earth’s warming trends are most pronounced in the Arctic, which NASA analysis shows is warming more than three times as fast as the rest of the globe over the past 30 years. The loss of Arctic sea ice — whose annual minimum area is declining by about 13 percent per decade — makes the region less reflective, meaning more sunlight is absorbed by the oceans and temperatures rise further still. This phenomenon, known as Arctic amplification, is driving further sea ice loss, ice sheet melt and sea level rise, more intense Arctic fire seasons, and permafrost melt.
In July 2005, the head of the National Academy of Sciences, climatologist Ralph Cicerone appeared before the U.S. Congress and said: “Nearly all climate scientists today believe that much of the Earth’s current warming has been caused by increases in the amount of greenhouse gases in the atmosphere, mostly from burning fossil fuels." “In 2015, 196 parties signed the "Paris Agreement," which aims to limit global warming preferably to 1.5 degrees Celsius —which is considered a dangerous level.
Elizabeth Kolbert wrote in National Geographic, “Since the start of the industrial revolution, enough fossil fuels — coal, oil, and natural gas — have been burned and enough forests cut down to emit more than 500 billion tons of CO2. As is well known, the atmosphere has a higher concentration of CO2 today than at any point in the past 800,000 years and probably a lot longer. [Source: Elizabeth Kolbert, National Geographic, April 2011]
Greenhouse Effect and Carbon Dioxide in the Atmosphere
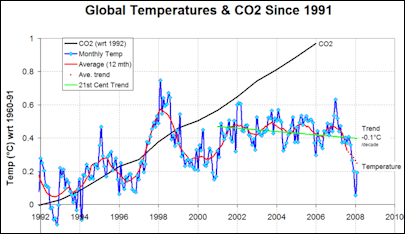
global temperatures between 1991 and 2008 The greenhouse effect is the process in which the gases in the Earth's atmosphere catch infrared radiation from the Earth — the same a greenhouse does. Infrared radiation is what keeps the Earth warm at night when the sun is not warming it. If it doesn’t occur most life on earth would perish. But if occurs too much the Earth heats up to harmful levels.
When sunlight strikes the Earth's atmosphere, some sun rays bounces off into space but most penetrates the atmosphere and makes their way to earth's surface. Most of the heat is absorbed by bands of air a few kilometers from the ground. Some of this heat is radiated into space in the form on infrared radiation. Some escapes the atmosphere but most is redirected back towards the Earth like the glass of a greenhouse by greenhouse gases such as carbon dioxide, methane, nitrous oxide, and water vapor.
Each year humans release about 7 billion metric tons of carbon dioxide into the Earth’s atmosphere: about 6.5 million tons is from fossil fuels, 1.5 billion from deforestation. Carbon dioxide emissions from automobiles, power plants and factories grew 1.1 percent in the 1990s and grew 3 percent from 2000 to 2004.
Carbon dioxide concentrations in the atmosphere were 180 parts per million (p.p.m.) during the last Ice Age. In the 18th century, before the onset of the Industrial Revolution and intensive burning of coal they stood at 280 p.p.m, then reached 315 p.p.m. in the 1950s and have since climbed to over 380 p.p.m. today.
Comparing current air to air bubbles trapped in Antarctic ice Edward Brook of Oregon State University reported in Science that there is more carbon dioxide in the air now than there has been at any time in the last 650,000 years. Others have put the figure at 800,000 years.
Yearly Global Temperatures
According to NASA: The largest source of year-to-year variability in global temperatures typically comes from the El Nino-Southern Oscillation (ENSO), a naturally occurring cycle of heat exchange between the ocean and atmosphere. While the year has ended in a negative (cool) phase of ENSO, it started in a slightly positive (warm) phase, which marginally increased the average overall temperature. One of the two warmest years on record, 2016, received a significant boost from a strong El Nino.
In the long term, parts of the globe are also warming faster than others. Earth’s warming trends are most pronounced in the Arctic, which NASA analysis shows is warming more than three times as fast as the rest of the globe over the past 30 years, according to Schmidt. The loss of Arctic sea ice — whose annual minimum area is declining by about 13 percent per decade — makes the region less reflective, meaning more sunlight is absorbed by the oceans and temperatures rise further still. This phenomenon, known as Arctic amplification, is driving further sea ice loss, ice sheet melt and sea level rise, more intense Arctic fire seasons, and permafrost melt.
NASA, NOAA, the Berkeley Earth research group and the Met Office Hadley Centre (UK) all calculate year-on year global temperatures. Though there are minor variations from year to year, all four temperature records show peaks and valleys in sync with each other. All show rapid warming in the past few decades, and all show the past decade has been the warmest. The NASA data represents surface temperatures averaged over both the whole globe and the entire year. Local weather plays a role in regional temperature variations, so not every region on Earth experiences similar amounts of warming even in a record year.
NASA’s analysis incorporates surface temperature measurements from more than 26,000 weather stations and thousands of ship- and buoy-based observations of sea surface temperatures. These raw measurements are analyzed using an algorithm that considers the varied spacing of temperature stations around the globe and urban heating effects that could skew the conclusions if not taken into account. The result of these calculations is an estimate of the global average temperature difference from a baseline period of 1951 to 1980.
NASA measures Earth's vital signs from land, air, and space with a fleet of satellites, as well as airborne and ground-based observation campaigns. The satellite surface temperature record from the Atmospheric Infrared Sounder (AIRS) instrument aboard NASA’s Aqua satellite confirms the NASA results of the past seven years being the warmest on record. Satellite measurements of air temperature, sea surface temperature, and sea levels, as well as other space-based observations, also reflect a warming, changing world. The agency develops new ways to observe and study Earth's interconnected natural systems with long-term data records and computer analysis tools to better see how our planet is changing. NASA shares this unique knowledge with the global community and works with institutions in the United States and around the world that contribute to understanding and protecting our home planet.
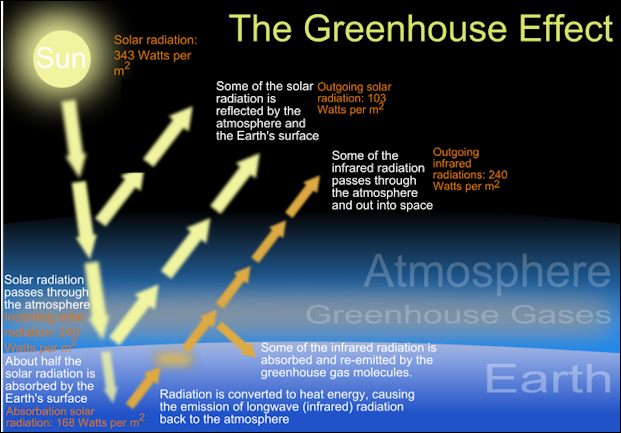
The greenhouse effect
2020 — the Hottest Year on Record
Earth’s global average surface temperature in 2020 just beat out out 2016 as the warmest year on record, according to an analysis by NASA’s Goddard Institute for Space Studies (GISS) in New York. NASA reported: Continuing the planet’s long-term warming trend, the year’s globally averaged temperature was 1.84 degrees Fahrenheit (1.02 degrees Celsius) warmer than the baseline 1951-1980 mean., according to scientists at 2020 edged out 2016 by a very small amount, within the margin of error of the analysis, making the years effectively tied for the warmest year on record.
“The last seven years have been the warmest seven years on record, typifying the ongoing and dramatic warming trend,” said GISS Director Gavin Schmidt. “Whether one year is a record or not is not really that important — the important things are long-term trends. With these trends, and as the human impact on the climate increases, we have to expect that records will continue to be broken.”
A separate, independent analysis by the National Oceanic and Atmospheric Administration (NOAA) concluded that 2020 was the second-warmest year in their record, behind 2016. NOAA scientists use much of the same raw temperature data in their analysis, but have a different baseline period (1901-2000) and methodology. Unlike NASA, NOAA also does not infer temperatures in polar regions lacking observations, which accounts for much of the difference between NASA and NOAA records. According to NOAA, parts of the continental United States experienced record high temperatures in 2020, while others did not. Like all scientific data, these temperature findings contain a small amount of uncertainty — in this case, mainly due to changes in weather station locations and temperature measurement methods over time. The GISS temperature analysis (GISTEMP) is accurate to within 0.1 degrees Fahrenheit with a 95 percent confidence level for the most recent period.
While the long-term trend of warming continues, a variety of events and factors contribute to any particular year’s average temperature. Two separate events changed the amount of sunlight reaching the Earth’s surface. The Australian bush fires during the first half of the year burned 46 million acres of land, releasing smoke and other particles more than 18 miles high in the atmosphere, blocking sunlight and likely cooling the atmosphere slightly. In contrast, global shutdowns related to the ongoing coronavirus (COVID-19) pandemic reduced particulate air pollution in many areas, allowing more sunlight to reach the surface and producing a small but potentially significant warming effect. These shutdowns also appear to have reduced the amount of carbon dioxide (CO2) emissions last year, but overall CO2 concentrations continued to increase, and since warming is related to cumulative emissions, the overall amount of avoided warming will be minimal. The previous record warm year, 2016, received a significant boost from a strong El Nino. The lack of a similar assist from El Nino this year is evidence that the background climate continues to warm due to greenhouse gases,” Schmidt said.
2021 — Sixth Hottest Year on Record
The climate in 2021 was ranked the sixth-warmest on record, according data from NASA, NOAA and Berkeley Earth. Axios reported: The three temperature tracking groups matched data released earlier this week by the European Union's Copernicus Climate Change Service, and show how the presence of a La Niña event in the tropical Pacific Ocean, which features cooler than average sea surface temperatures near the equator, failed to dislodge 2021 from the list of top 10 years. [Source: Andrew Freedman, Axios., January 14, 2022, 1:00 AM
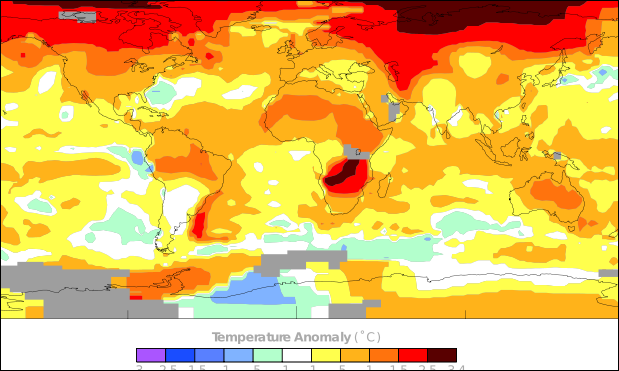
Global Surface Temperatures in 2005
2021 featured a relentless series of extreme weather and climate disasters that saw temperatures and water levels reach unprecedented levels. A June heat wave in the Pacific Northwest, for example, set a temperature record for the hottest reading (121°F) ever seen in Canada, along with all-time highs in Oregon and Washington. The town that set the Canadian record, Lytton, British Columbia, burned in a wildfire the next day. A study found the heat wave could not have occurred without human-caused global warming. "Changes in extreme events are global warming writ local," NASA's Gavin Schmidt said. Four of the top 20 largest wildfires in California history occurred in 2021, as heat waves and drought primed the environment for massive blazes. This included the second-largest blaze on record, the Dixie Fire, which scorched more than 963,000 acres.
“To illustrate how much the world has warmed in many peoples' lifetimes, consider these two facts, one from NOAA and one from NASA: The world has not experienced a cooler than average year, compared to the 20th century average, since 1977. In NASA's data set, 1988 — the year that climate scientist James Hansen famously testified before Congress, warning that human-caused global warming was underway — long reigned as the warmest year on record. Due to the warming since then, 1988 now stands as the 28th warmest year in NASA's data set, according to Schmidt.
“The world is now 1.2°C (2.2°F) warmer than preindustrial levels, Berkeley Earth found, closing in on the Paris Climate Agreement's temperature target of limiting warming to 1.5°C above preindustrial levels. Nearly 2 billion people lived through their hottest year on record in 2021, since 25 countries earned this distinction, including China and Nigeria. No place on Earth had its coldest year on record, according to Berkeley Earth. The nine years from 2013 through 2021 rank among the top 10 warmest years on record, according to NOAA. Even the world's relatively "cool" years are now ranking among the top eight warmest on the list, with no prospect of slowing global warming, scientists say, unless the world bends the greenhouse gas emissions curve sharply downward, all the way to zero and eventually below zero in coming decades.
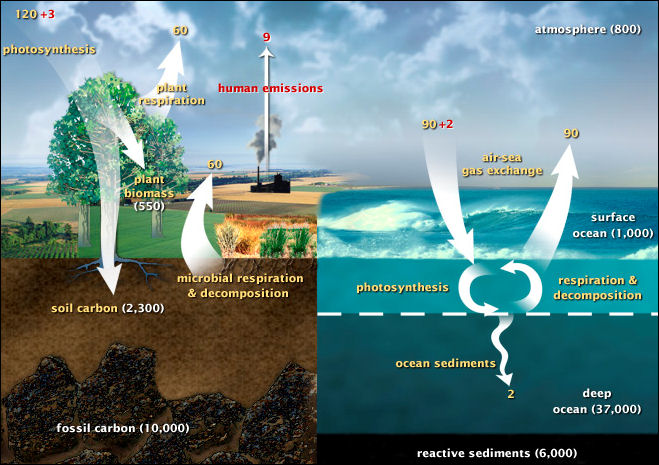
Carbon cycle
Carbon Dioxide Levels Hit New High in 2021
NOAA said carbon dioxide levels in the atmosphere increased to 2.66 parts per million in 2021 over 2020, one of the higher increases in history but not a record. The annual average for 2021 for carbon dioxide was 414.7 parts per million. Pre-industrial is about 280 parts per million. NOAA said carbon dioxide are now the highest since about 4.3 millions year when the sea level was about 75 feet (23 meters) higher and the average temperature was about 7 degrees Fahrenheit (3.9 degrees Celsius) warmer. [Source: Seth Borenstein, Associated Press, April 8, 2022]
Carbon dioxide levels in the air peaked in May 2021 to a new all time high, and amount nearly 50 percent higher than when the industrial age began and they are growing at a record fast rate. Associated Press reported: The National Oceanic and Atmospheric Administration said the average carbon dioxide level for May was 419.13 parts per million. That’s 1.82 parts per million higher than May 2020 and 50 percent higher than the stable pre-industrial levels of 280 parts per million, said NOAA climate scientist Pieter Tans. [Source: Seth Borenstein, Associated Press, June 8, 2021
“Carbon dioxide levels peak every May just before plant life in the Northern Hemisphere blossoms, sucking some of that carbon out of the atmosphere and into flowers, leaves, seeds and stems. The reprieve is temporary, though, because emissions of carbon dioxide from burning coal, oil and natural gas for transportation and electricity far exceed what plants can take in, pushing greenhouse gas levels to new records every year.
See Separate Article CLIMATE CHANGE GASES AND SOURCES factsanddetails.com
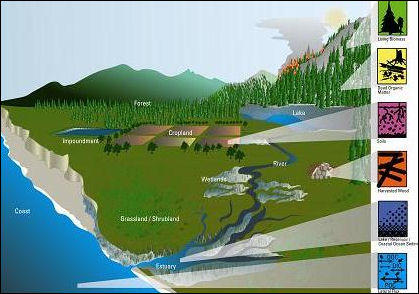
Carbon Cycle
Carbon is the chemical backbone of life on Earth, a key element in many important processes. Carbon compounds help to regulate the Earth’s temperature, make up the food that sustains us, and provide a major source of the energy to fuel our global economy. Most of Earth’s carbon is stored in rocks and sediments, while the rest is located in the ocean, atmosphere, and in living organisms - these are the reservoirs through which carbon cycles.
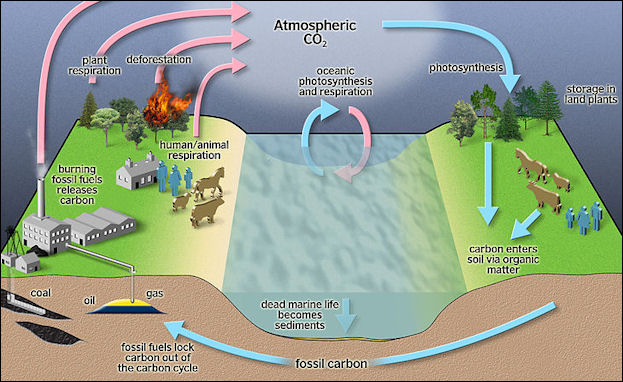
carbon cycle on a larger scale
Carbon Storage and Exchange: Carbon moves from one storage reservoir to another through a variety of mechanisms. One example is the movement of carbon through the food chain. Plants move carbon from the atmosphere into the biosphere through photosynthesis: they take in carbon dioxide and use energy from the sun to chemically combine it with hydrogen and oxygen to create sugar molecules. Animals that eat the plant can digest the sugar molecules to get energy for their bodies. Respiration, excretion, and decomposition release the carbon back into the atmosphere or soil continuing the cycle.
The ocean plays a critical role in the storage of carbon, as it holds about 50 times more carbon than the atmosphere. Two-way carbon exchange can occur quickly between the ocean’s surface waters and the atmosphere, but carbon may also be stored for centuries at the deepest ocean depths.
Rocks such as limestone and fossil fuels such as coal and oil are storage reservoirs that contain carbon from plants and animals that lived millions of years ago. When these organisms died, slow geologic processes trapped their carbon and transformed it into these natural resources. Processes such as erosion release this carbon back into the atmosphere very slowly while volcanic activity can release it very quickly. Burning of fossil fuels in cars or power plants is another way this carbon can be released into the atmospheric reservoir quickly.
The increasing human population and their activities have a tremendous impact on the carbon cycle. Burning of fossil fuels, changes in land use, and the use of limestone to make concrete all transfer significant quantities of carbon into the atmosphere. As a result the amount of carbon dioxide (CO2) in the atmosphere is rapidly rising and is already significantly greater than at any time in the last 800,000 years. This increase of CO2 is affecting our ocean as it absorbs much of the CO2 that is released from burning fossil fuels. This extra CO2 is lowering the ocean’s pH, this process is called ocean acidification and interferes with the ability of marine organisms (such as corals) to build their shells and skeletons.
Evidence of Global Warming
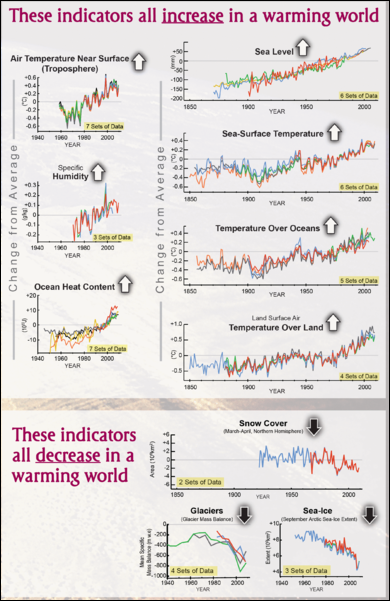
Changes in climate indicators
that show global warming In the 20th century global temperatures rose by 1̊ Fahrenheit (or 0.6̊ Centigrade) with two distinct period of warming: one between 1910 and 1945 and the other between 1976 and 2000. The 1990s were the hottest decade on record. Since the Industrial Revolution global carbon dioxide levels have increased by 30 percent. Some say temperatures now may be the highest they have been in the last 20 million years.
The amount of greenhouse gases in the atmosphere rose from 280 parts per million (ppm) in the 19th century to near 420 ppm today and is expected to reach 550 ppm between 2035 and 2050. Data released in March 2006, indicated that carbon dioxide levels were increasing at a rate double that of the mid 1970s. The amount greenhouse gases released into the atmosphere increased 70 percent between 1970 and 2004 and is expected to rise another 25 percent to 90 percent by 2030.
The Earth currently seems to be heating up at an alarming rate, faster than researchers predicted or anticipated. As of 2007 the 10 warmest years had all occurred since 1994. As it stands now most of the hottest years were in the 2010s. A study released in 2006 showed that temperatures rose one degree F between 1975 and 2005, higher than the rate between 1900 and 1975. Global temperatures in 1998 were high in part because of an El Niño phenomena. What was alarming about 2005 was that year there was no El Niño and the year was also unusually stormy and dry. By 2026 it is estimated the global temperature will be 2̊C above what it was in 1750.
Not all the evidence is conclusive. There is evidence that temperatures in Northern Hemisphere have increased by 2̊F since the Industrial Revolution while temperatures in the rest or the world have cooled. Some studies said temperature in the Antarctic have risen 3.6̊C since the 1970s while other data suggests temperatures are dropping at the South Pole. Global temperatures have fluctuated throughout history. The so-called Little Ice Age that began in the 14th century; and some say it continued until the 1860s. This followed a warm period in the 8th through 10th centuries.
The jury is still out on how quickly temperatures will rise in the future and the consequences these rises will have. Estimates of global warming temperature changes in the 21st century range from 1.1 degrees C to 6.4 degrees C. The “best estimates” by the Intergovernmental Panel of Climate Change (IPCC) put the figure at 3.2 to 4 degrees C (from pre-industrial times by 2100). Some scientists predict that temperatures will rise 5.8̊C by 2100 and say a temperature rise of over 4 degrees F would “imply changes that constitute practically a different planet.” Other say if stringent measures are taken the figure could be reduced to 2 to 2.4 degrees.
Further evidence of global warming includes: increases in the temperature of the world's oceans over the last four decades and melting and retreating ice caps and glaciers. The 2000s was the hottest decade on record. Still global temperatures were largely stable during the 2000s The plateau occurred after a sharp rise in the 1990s. Some predict global temperatures may even drop in upcoming years. This evidence is embraced by global warming skeptics who say day that the doom and gloom scenarios painted by many scientists is greatly exaggerated.
Keeling Curve and Groundbreaking Global Warming Studies
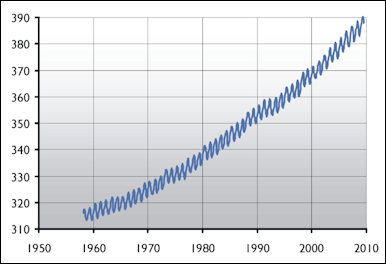
CO2 Mauna Loa The Keeling Curve is a graph which plots the ongoing change in concentration of carbon dioxide in Earth's atmosphere since 1958. It is based on continuous measurements taken at the Mauna Loa Observatory in Hawaii under the supervision of Charles David Keeling of the Scripps Institution of Oceanography at UC San Diego. Keeling's measurements showed the first significant evidence of rapidly increasing carbon dioxide levels in the atmosphere. Many scientists credit Keeling's graph with first bringing the world's attention to the issue of in the issue of global warming and climate change.
Keeling was the first person to make frequent regular measurements of the atmospheric carbon dioxide (CO2) concentration, taking readings in Hawaii from 1958 onwards. The measurements collected at Mauna Loa show a steady increase in mean atmospheric CO2 concentration from about 315 parts per million by volume (ppmv) in 1958 to 392 ppmv as of July 2011. This increase in atmospheric CO2 is considered to be largely due to the combustion of fossil fuels, and has been accelerating in recent years.
In 1998, Michael Mann of the University of Massachusetts in Amherst, published the so called “hockey stick” graph that showed a sharp hockey-stick-like upturn in carbon dioxide level beginning at the time of the industrial revolution. The data for older dates came from judging historical temperatures and carbon dioxide levels based on tree rings, ice core samples and coral reef data. Critics of this study didn’t like the reliance on tree rings for historical temperatures.
A study released in 2005 based in satellite measurements and date collected from the sea buoys indicated the Earth is absorbing more energy from the sun than it is emitting back into space as heat. This is in line with what is expected from global warming.
In June-August 2009 the world’s ocean surface temperature, according to NOAA, was the warmest it has ever been since 1880 when such measurements began. The high temperature were attributed to El Nino weather patterns and the affects of global warming. Temperatures in the North Atlantic have increased as much as 2 degrees C since the 1990s. Fish such as blue sharks and flounder have been seen in waters off of Iceland further north than they have ever been seen before.
Data from satellites and weather balloons indicates that the troposphere, the part of the atmosphere near the Earth’s surface, is warming up, while the stratosphere, the atmospheric layer, above the troposphere, is cooling. This contradicts the idea that warming is being caused by a hotter sun.
IPCC Reports
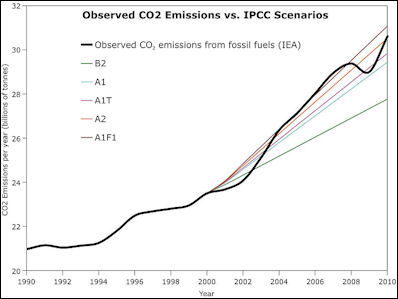
The Intergovernmental Panel of Climate Change (IPCC) is a United-Nations-sponsored research body made up of around 2,500 scientists from 130 countries, whose results are accepted by more than 100 countries. Founded in 1988, it issued its first report in 1990 and issued others in 1995 and 2001. In 2007, it and Al Gore were awarded the Nobel Peace Prize for their efforts to spread awareness about climate change. The Pew Center on Global Climate Change is another influential group involved in climate change issues. There are any others organizations also involved with the issue. The 3000-page “Third Assessment Report“an IPCC document released in 2001 containing peer-reviewed studies by thousands of oceanographers, climatologists, geographers and other scientists — predicted the Earth will warm between 2.5 and 10.4 degrees in terms of the global mean by 2100 unless greenhouse gas emission are cut below current levels.
According to the 2007 IPCC report by “Warming of the climate system is unequivocal.” In a series of reports released in 2007 the IPCC warned of devastating floods, hurricanes, and typhoons associated with global warming and said 30 percent of the world’s animal and plant species could become extinct and hunger and famine could affect 500 million people and water shortages could affect billions if something isn’t done soon and said with 90 percent certainty that global warming is man-made. An updating of the 2007 report in 2009 insisted global warming was worse than originally predicted: “The worst-case IPCC scenario trajectories are being realized....There is a significant risk that many of the trends will accelerate, leading to an increasing risk of abrupt or irreversible climate shifts.”
In 2017, the IPCC was charged with drafting a series of reports detailing its science, the effects on the planet and how humanity might save itself. The October 2018 IPCC report said that if greenhouse gas emissions continued at the current rate, the atmosphere would warm by as much as 2.7 degrees Fahrenheit (1.5 degrees Celsius) above preindustrial levels by 2040. Under the same scenario in the Himalayas, that figure could reach 3.8 degrees Fahrenheit (2.1 degrees Celsius), the Hindu Kush Himalaya Assessment found. The last of the IPCC reports was made public in April 2022. In it, scientists said a climate change crisis was happening now and unless drastic changes were made the changes could be dire and irreversible. We can’t kick this can down the road any longer,” said Andrea Dutton, a geoscientist at the University of Wisconsin, Madison. [Source: Elizabeth Weise, USA Today, April 7, 2022]
Measuring Global Warming
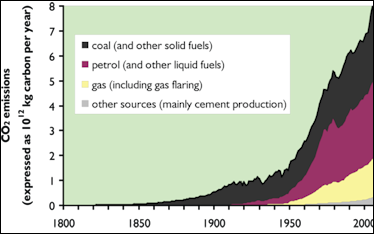
Carbon sources Keeling (of the Keeling Curve mentioned above) had perfected the measurement techniques and observed "strong diurnal behaviour with steady values of about 310 ppm in the afternoon" at three locations: Big Sur near Monterey, the rain forests of Olympic Peninsula and high mountain forests in Arizona. By measuring the ratio of two isotopes of carbon, Keeling attributed the diurnal change to respiration from local plants and soils, with afternoon values representative of the "free atmosphere". By 1960, Keeling and his group established the measurement record that was long enough to see not just the diurnal and seasonal variations, but also a year-on-year increase that roughly matched the amount of fossil fuels burned per year. In the article that made him famous, Keeling observed, "at the South Pole the observed rate of increase is nearly that to be expected from the combustion of fossil fuel".
Today measurements of carbon dioxide and other gases and materials are taken in 15-foot-long tubes in places like Iceland and Algeria and are sent to Boulder, Colorado where they are analyzed in a high-tech laboratory. Temperatures in the past can be determined from tree rings (wider rings mean warmer years), corals (which produce layers whose density varies according to the sea temperatures at the times they were deposited), fossil shells (shells of some macroscopic organisms provide clues on sea temperatures in ancient times), and ice cores (chemical compositions of trapped air samples are different in warm years than in cold ones).
Scientists also examine glacier moraines, sand dunes, microscopic shells and organisms buried in deep sea sediments. Cores taken from lakes show pollen levels from ancient times. Isotopes of uranium in stalactites and deposits of mud provide clues about flooding, and rainfall levels. Seeds, leaves, twigs collected by pack rats and preserved in their crystalized urine and feces gives scientists an idea of what plants were living as far back as 30,000 years ago.
Carbon Dioxide Absorption and Seasonal Changes
Some scientists have suggest that global warming would be even worse than it now were it not for particle pollution and volcanic eruptions shadowing the Earth and producing a cooling effects.Global warming would also be a lot worse than it is if all of remained in the atmosphere. About 40 percent of the carbon dioxide produced by fossil fuels is soaked up. Where the it goes no one is completely sure. Much of the missing carbon is believed to be soaked up by the ocean, which has the capacity to ingest huge amounts of carbon dioxide.
Carbon dioxide levels change on a seasonal basis with decreases in the spring and summer when plant life is absorbing carbon dioxide through photosynthesis and increases in the fall and winter when less photosynthesis takes place.
In the laboratory, plants that are given more carbon dioxide grow faster and soak up more carbon dioxide. If this phenomena were true in the real world excess carbon dioxide could cause plants to grow faster and soak up carbon dioxide but unfortunately that is not the case. Studies have shown that plants undergo an initial burst of growing when given more carbon dioxide but that tapers of off later.
Models of Global Warming
Scientists have devoted a lot of time and money to creating very complex supercomputer models that attempt to predict global warming and its consequences. The jury is still out on how well these models predict the future. Also whether climatic and weather variations are caused by global warming or natural weather changes is difficult to say.
Jonathan Bamber wrote in The Conversation: Scientists have developed models of the global climate system, called general circulation models, or GCMs for short, that reproduce the major patterns seen in weather observations. This helps us track and predict the behaviour of climate phenomena such as the Indian monsoon, El Niño, Southern Oscillations and ocean circulation such as the gulf stream. GCMs have been used to project changes to the climate in a world with more atmospheric CO since the 1990s. A common feature of these models is an effect called polar amplification. This is where warming is intensified in the polar regions and especially in the Arctic. The amplification can be between two and two and a half, meaning that for every degree of global warming, the Arctic will see double or more. [Source: Jonathan Bamber, Professor of Physical Geography, University of Bristol, The Conversation, Published: June 25, 2020]
Scientifically connecting a weather disaster with global warming is a complicated and time-consuming task that can take more than a year and involve lots of computer calculations.One of the big question marks in fully grasping the impact of global warming is the influence of clouds. For example if the atmosphere warms this causes more evaporation and cloud production. The clouds and water vapor can act like greenhouses gases to trap heat. They can also reflect and absorb heat coming in from the sun. The affects on these phenomena are on global warming are not really known and are very difficult to predict or model.
Other important variables include: 1) the amount of sea ice, which promotes cooling by reflecting sunlight into space; 2) the amount of plants of trees which absorb carbon dioxide; and 3) melting of permafrost, which releases carbon dioxide and methane.
One study by Gerald Roe and Marcia Bka the University of Washington in Seattle published in Science in 2007 found that even though scientists now possess mountains of data about global warming they are no better predicting its effects than 20 years earlier. One of the main findings was that as temperatures rise the outcomes of those rises become more uncertain and thus it becomes more difficult to predict their consequences
Sometimes it is difficult to understand what is really going when one is bombarded with often contradictory data. W. Tad Pfeffer, an expert on Greenland’s ice sheets at the University of Colorado, told New York Times, “One of the things that troubles me most is that the rapid-fire publication of unsettled results in highly visible venues creates the impression that the scientific community has no idea what’s going on...each new paper negate or repudiates something emphatically asserted in a previous paper. The public is obviously picking up on this not as an evolution of objective scientific understanding but as a proliferation of contradictory opinions.”
Fractional Risk Attribution
Climatologists for the most part have been reluctant to attribute single events of extreme weather to climate change. Usually what they say is that extreme events are getting more likely as the amount of greenhouse gases in the atmosphere rises but tactfully hold back from casting any blame. Sharon Begley wrote in Newsweek, “Finally, climate scientists see a way to stop being so wishy-washy and start assigning blame, through a technique called “fractional risk attribution.” This technique uses mathematical models of how the atmosphere would work if we had not goosed carbon dioxide to 389 ppm (from 278 before the Industrial Revolution), plus data about ancient (“paleo”) climates and historical (more recent) weather. The idea is to calculate how many times an extreme event should have occurred absent human interference, explains climate scientist Ben Santer of Lawrence Livermore National Lab, and the probability of the same extreme event in today’s greenhouse-forced atmosphere. Result: putting numbers on extreme weather. [Source: Sharon Begley, Newsweek, November 27, 2010]
In their biggest success, climate scientists led by Peter Stott of the British Met Office analyzed the 2003 European heat wave, when the mercury rose higher than at any time since the introduction of weather instruments (1851), and probably since at least 1500. After plugging in historical and paleo data, and working out climate patterns in a hypothetical world without a human-caused greenhouse effect, they conclude that our meddling was 75 percent to blame for the heat wave. Put another way, we more than doubled the chance that it would happen, and it’s twice as likely to be human-caused than natural. That’s one beat shy of “Yes, we did it,” but better than “There’s no way to tell.”
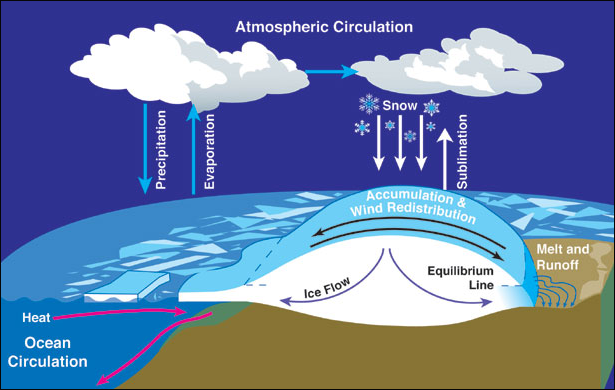
Mass balance atmospheric circulation
Scientists are now applying the technique to other extreme weather, especially deluges and droughts. They have reason to be optimistic. One of the signal successes of climate science has been identifying the “fingerprints” of the culprits behind rising temperatures, fierce storms, and other signs that a 10,000-year-old climate regime has been knocked for a loop. Fingerprinting has shown that the rise in global temps follows the pattern you’d expect from the greenhouse effect and not an increase in the sun’s output, for instance. A hotter sun would heat the upper atmosphere more than the lower, but in fact the upper layers have cooled while the lower have warmed, Santer explains. Fingerprinting has also nailed the greenhouse effect for warming the oceans. Natural forces such as El Niño warm some seas and cool others, but every major ocean is hotter than in the 1950s. Similar analyses have been done for today’s extreme rainfall patterns (drought followed by deluge, not precipitation spread out evenly) and the retreat of arctic sea ice. “Natural causes alone can’t explain any of these,” Santer says. “You need a large human contribution.”
Inevitability of Global Warming in the Future
It is going to be hard to stop global warming. Even if emissions are reduced to zero today temperatures will likely continue to rise as a result of the time it takes for heating to reach its maximum effect on the atmosphere. There are still a lot of uncertainties though. The goal by global warming policy makers at this juncture is to contain the damage even though objectives and goals may be uncertain because it is not clear what the thresholds are.
In many ways the argument is beginning to shift from if to when with a certain degree of resignation that the consequence of global warming are inevitable and too much irreversible damage has already been done. In line with this thinking is the belief that one is better to make preparations and be ready for the inevitable changes by planting weather-resistant crops and developing shoreline taking into account future seas level rises.
Many think it is already too late to halt the onset of global warming. It has already happened and makes more sense to learn to live its consequences. John Holdren, a climate expert at Harvard, told the New York Times, “We basically have three choices — mitigation, adaption and suffering. We’re going to do some of each. The question is what the mix is going to be. The more mitigation we do, the less adaption will be required and the less suffering there will be.”
Some scientists predict major shortages of food and water and dislocations of large number of people occurring because of global warming in relatively short periods of time. Generals and admirals in war colleges are already preparing for such events and hostilities. Conflicts, even wars, could occur as a result from such events. Syria-Turkey, India-Pakistan and Greece-Macedonia are seen as potential trouble spots.
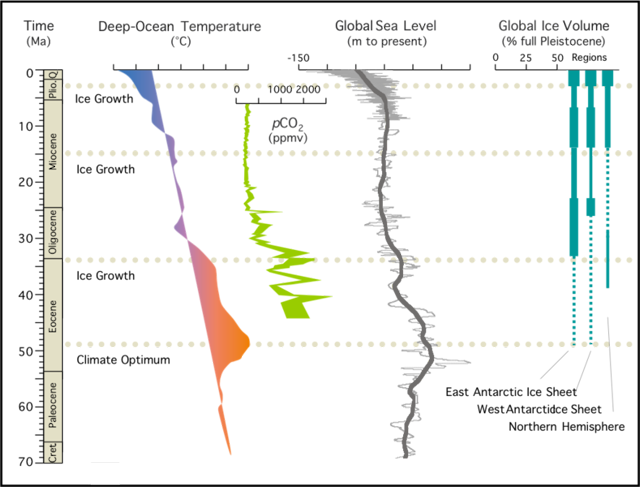
If the burning of fossil fuels was stopped today, by some estimates, it would take about 100,000 years for the all the carbon dioxide created already by man to vanish from the atmosphere — with much of it ending up on the bottom of the sea in deposits that will eventually become limestone.
Image Sources: World Meteorological Organization; National Oceanic and Atmospheric Administration (NOAA), Wikimedia Commons
World Meteorological Organization; National Oceanic and Atmospheric Administration (NOAA), Text Sources: New York Times, Washington Post, Los Angeles Times, Times of London, Yomiuri Shimbun, The Guardian, National Geographic, The New Yorker, Time, Newsweek, Reuters, AP, Lonely Planet Guides, Compton’s Encyclopedia and various books and other publications.
Last updated April 2022
